

Question: Calculate expected alpha values for Stocks A and B . A portfolio manager summarizes the input from the macro and micro forecasts in the following
Calculate expected alpha values for Stocks A and B A portfolio manager summarizes the input from the macro and micro forecasts in the following table: Micro Forecasts Macro Forecasts Calculate expected alpha values for stock A rn A portfolio manager summarizes the input from the macro and micro forecasts in the following table: Micro Forecasts Macro Forecasts Calculate expected alpha values for stock BA portfolio manager summarizes the input from the macro and micro forecasters in the following table:
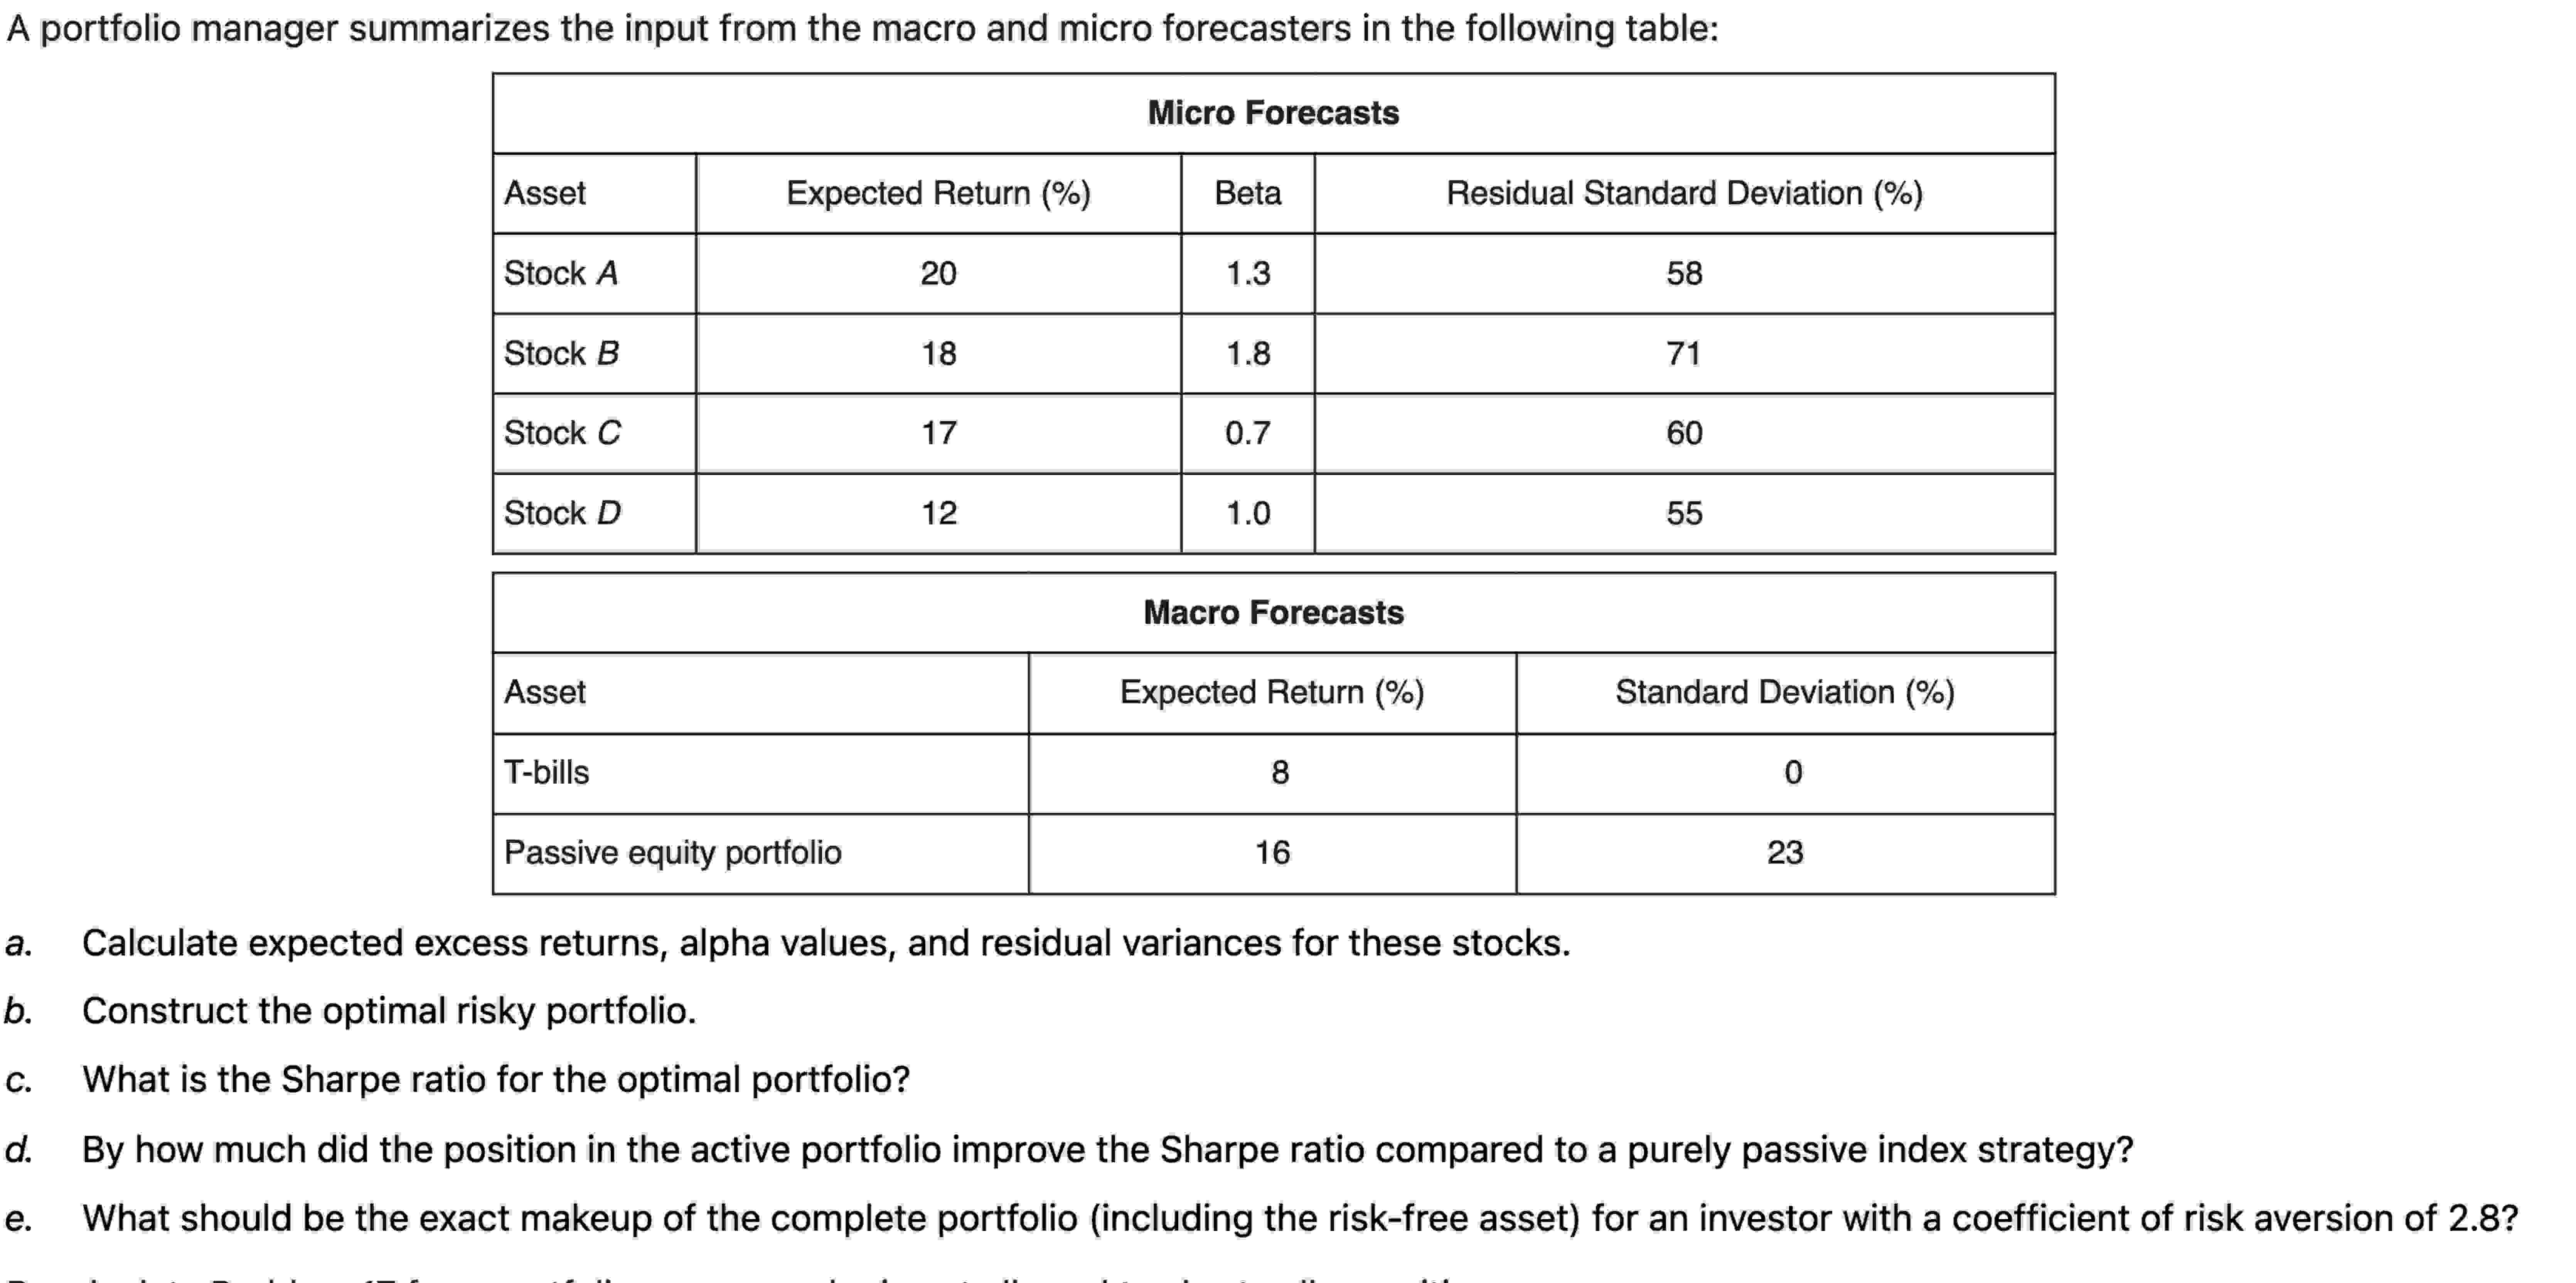
tableMicro Forecasts,AssetExpected Return Beta,Residual Standard Deviation Stock Stock Stock Stock
tableMacro ForecastsAssetExpected Return Standard Deviation Tbills,Passive equity portfolio,
a Calculate expected excess returns, alpha values, and residual variances for these stocks.
b Construct the optimal risky portfolio. using TreynorBlack technique with in depth calculations
c What is the Sharpe ratio for the optimal portfolio?
d By how much did the position in the active portfolio improve the Sharpe ratio compared to a purely passive index strategy?
e What should be the exact makeup of the complete portfolio including the riskfree asset for an investor with a coefficient of risk aversion of
Step by Step Solution
There are 3 Steps involved in it
1 Expert Approved Answer
Step: 1 Unlock

Question Has Been Solved by an Expert!
Get step-by-step solutions from verified subject matter experts
Step: 2 Unlock
Step: 3 Unlock