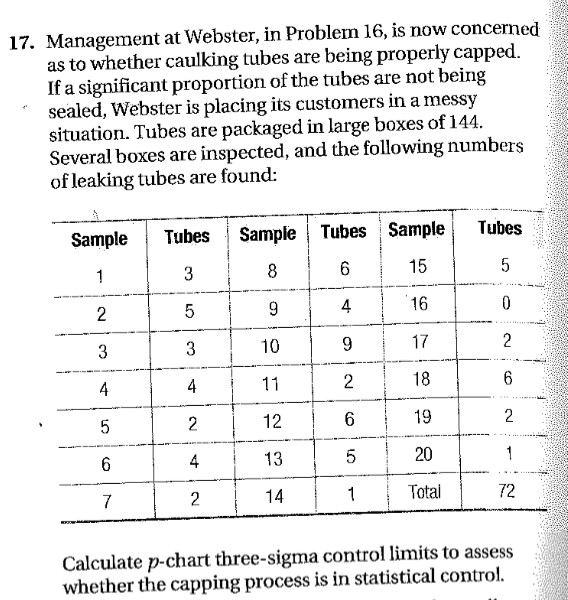
Question: Calculate p-chart three-sigma control limits to asses whether the capping process is in statistical control. SHOW ALL WORK 17. Management at Webster, in Problem 16,

Calculate p-chart three-sigma control limits to asses whether the capping process is in statistical control. SHOW ALL WORK

Calculate p-chart three-sigma control limits to

17. Management at Webster, in Problem 16, is now concerned as to whether caulking tubes are being properly capped. If a significant proportion of the tubes are not being sealed, Webster is placing its customers in a messy situation. Tubes are packaged in large boxes of 144. Several boxes are inspected, and the following numbers of leaking tubes are found: Sample Tubes Sample Tubes Tubes Sample 38 15 5 16 0 17 2 11 2 18 12 6 / 191 Ivo 4 13 5 20 14 Totai Calculate p-chart three-sigma control limits to assess whether the capping process is in statistical control

Step by Step Solution

There are 3 Steps involved in it

1 Expert Approved Answer
Step: 1 Unlock blur-text-image
Question Has Been Solved by an Expert!

Get step-by-step solutions from verified subject matter experts

Step: 2 Unlock
Step: 3 Unlock

Students Have Also Explored These Related General Management Questions!