

Question: Calculate p-chart three-sigma control limits to asses whether the capping process is in statistical control. Show all work. 17. Management at Webster, in Problem 16,
Calculate p-chart three-sigma control limits to asses whether the capping process is in statistical control. Show all work.
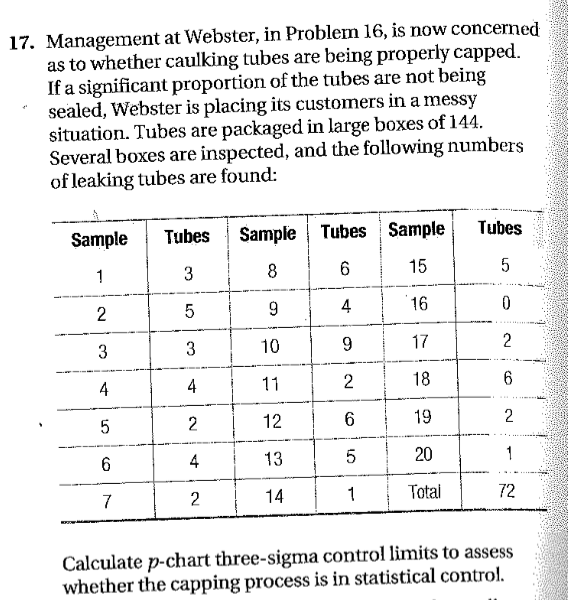
17. Management at Webster, in Problem 16, is now concerned as to whether caulking tubes are being properly capped. If a significant proportion of the tubes are not being sealed, Webster is placing its customers in a messy situation. Tubes are packaged in large boxes of 144. Several boxes are inspected, and the following numbers of leaking tubes are found: Sample Tubes Sample Tubes Tubes Sample 38 15 5 16 0 17 2 11 2 18 12 6 / 191 Ivo 4 13 5 20 14 Totai Calculate p-chart three-sigma control limits to assess whether the capping process is in statistical controlStep by Step Solution
There are 3 Steps involved in it
1 Expert Approved Answer
Step: 1 Unlock

Question Has Been Solved by an Expert!
Get step-by-step solutions from verified subject matter experts
Step: 2 Unlock
Step: 3 Unlock