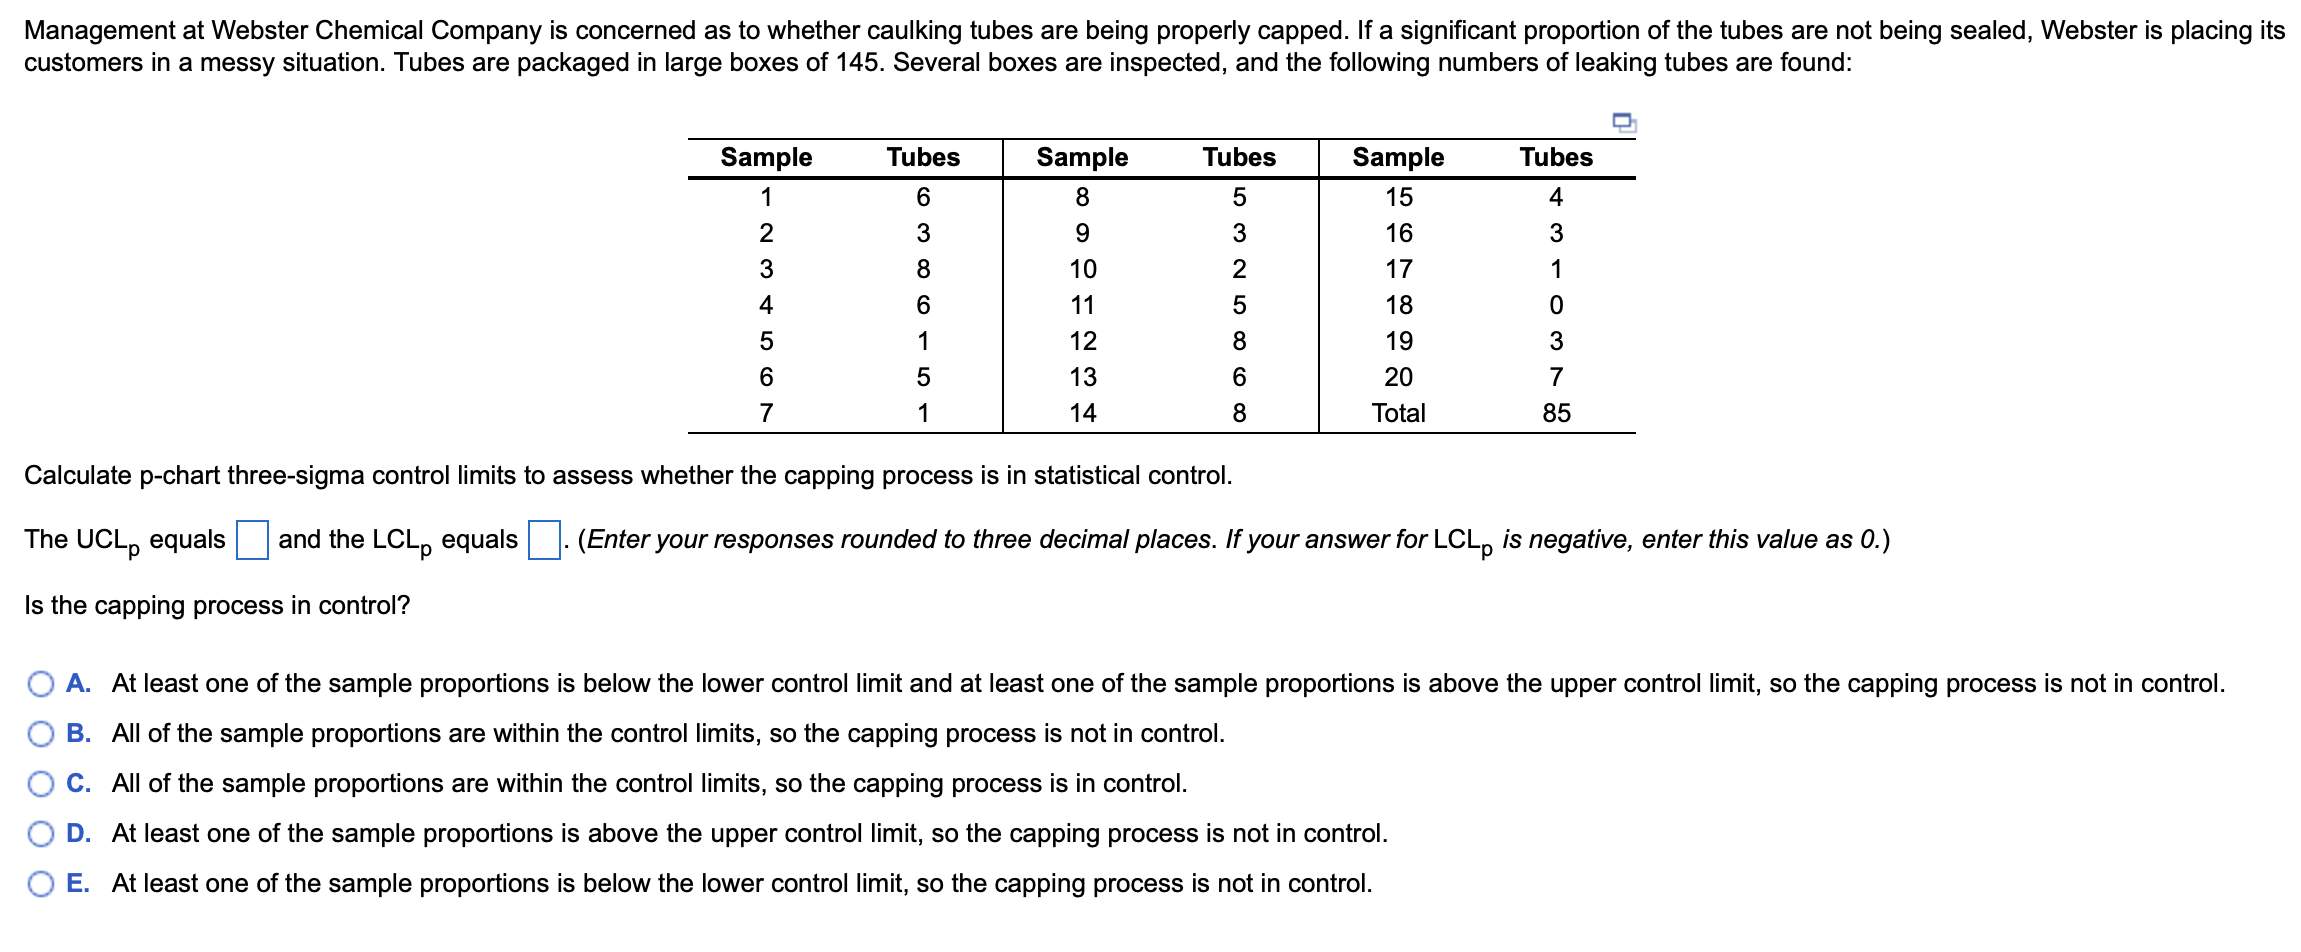
Question: Calculate p-chart three-sigma control limits to assess whether the capping process is in statistical control. The UCLp equals and the LCLp equals (Enter your responses

Calculate p-chart three-sigma control limits to

Calculate p-chart three-sigma control limits to assess whether the capping process is in statistical control. The UCLp equals and the LCLp equals (Enter your responses rounded to three decimal places. If your answer for LCLp is negative, enter this value as 0 .) Is the capping process in control? A. At least one of the sample proportions is below the lower control limit and at least one of the sample proportions is above the upper control limit, so the capping process is not in control. B. All of the sample proportions are within the control limits, so the capping process is not in control. C. All of the sample proportions are within the control limits, so the capping process is in control. D. At least one of the sample proportions is above the upper control limit, so the capping process is not in control. E. At least one of the sample proportions is below the lower control limit, so the capping process is not in control

Step by Step Solution

There are 3 Steps involved in it

1 Expert Approved Answer
Step: 1 Unlock blur-text-image
Question Has Been Solved by an Expert!

Get step-by-step solutions from verified subject matter experts

Step: 2 Unlock
Step: 3 Unlock

Students Have Also Explored These Related General Management Questions!