

Question: Calculate process mean (X-bar) and average range (R-bar). Find the LCL & UCL for an X-bar & R charts using the formulas in the Technology
Calculate process mean (X-bar) and average range (R-bar).
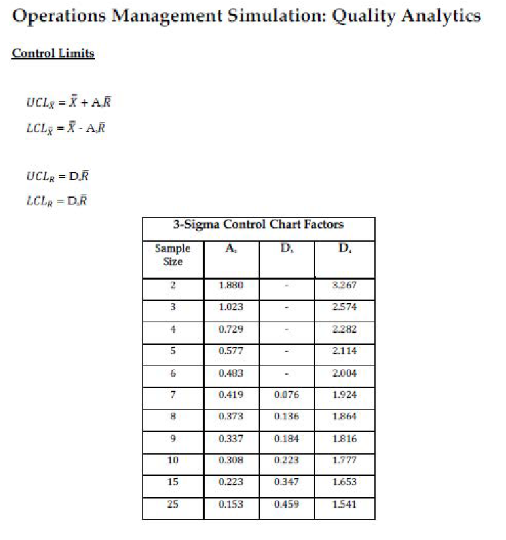
Find the LCL & UCL for an X-bar & R charts using the formulas in the Technology Primer (also available at the end of these instructions). Note that those formulas are not identical to the ones presented in the lecture and use shortcuts.
Shortcuts:
Data
| X-BAR | R |
| 29.17786824 | 9.846737279 |
| 29.41920731 | 7.326527512 |
| 26.22098903 | 5.215046078 |
| 31.03839537 | 12.98998725 |
| 31.18032898 | 5.610467967 |
| 30.14294911 | 12.6303436 |
| 29.73176862 | 9.211117517 |
| 29.78525681 | 7.220487228 |
| 31.5423799 | 11.44001586 |
| 29.29517815 | 9.302007383 |
| 30.66186928 | 9.232626559 |
| 31.25431636 | 8.484502318 |
| 31.78166657 | 8.401272151 |
| 29.45029354 | 3.58180589 |
| 26.69956619 | 10.19400761 |
| 29.77821565 | 6.622098194 |
| 28.45926431 | 7.915973057 |
| 28.90001457 | 12.28300571 |
| 28.68657517 | 7.569549402 |
| 29.37128721 | 6.853244314 |
| 29.70573775 | 6.219476693 |
| 30.64614946 | 11.96569981 |
| 29.84440924 | 4.698255732 |
| 28.32146463 | 7.958319562 |
| 30.6509834 | 8.341866803 |
| 27.47291893 | 5.462868937 |
| 28.59949126 | 7.702296312 |
| 27.94648943 | 3.379877443 |
| 30.12887304 | 5.842705467 |
| 28.20397336 | 8.737815376 |
| 30.57477517 | 7.939526439 |
| 30.72968499 | 5.334256249 |
| 29.66993886 | 4.895502668 |
| 30.78648695 | 6.733470967 |
| 29.94457654 | 7.310057675 |
| 30.83465746 | 4.817744952 |
| 32.5934681 | 8.312244228 |
| 29.4737988 | 6.922721662 |
| 31.70250892 | 6.651588067 |
| 30.35663744 | 8.074947054 |
| 31.26300923 | 10.33076303 |
| 29.89559144 | 7.407762757 |
| 31.04540068 | 13.07531516 |
| 29.29954717 | 9.377292266 |
| 29.6078817 | 8.554861982 |
| 30.80085648 | 9.835196489 |
What do the control limits tell us?
When a process is in-control, does it mean that it is producing an acceptable level of quality?
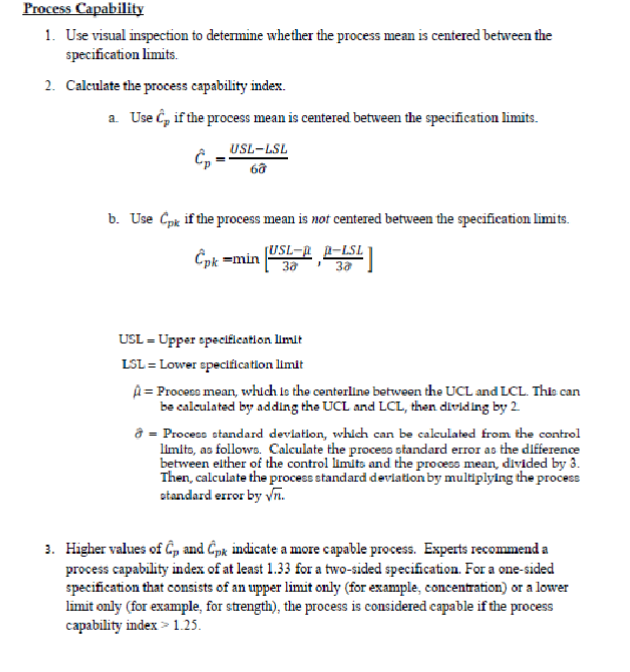
Operations Management Simulation: Quality Analytics Control Limits UCLX=X+ARLCLX=XA,R UCLR=DRLCLR=D,R "rocess Capability 1. Use visual inspection to determine whether the process mean is centered between the specification limits. 2. Calculate the process capability index. a. Use C^p if the process mean is centered between the specification limits. C^p=6aUSLLSL b. Use Cpk if the process mean is not centered between the specification limits. C^pk=min[3USL,3^USL] USL = Upper specifleation linlt LSL = Lower specifilcation llmit A^= Proceco mean, which 10 the centerline between the UCL and LCL. This can be caleulated by adding the UCL and LCL, then dividing by 2 = Process standard deviation, whech can be calculated from the control limito, as follows. Calculate the proceso standard error as the difference between elther of the control limils and the proceso mean, divided by 3 . Then, calculate the process standard deviation by multiplying the process otandard exror by n. 3. Higher values of C^p and C^pk indicate a more capable process. Experts recommend a process capability index of at least 1.33 for a two-sided specification. For a one-sided specification that consists of an upper linut only (for example, concentration) or a lower limit only (for example, for strength), the process is considered capable if the process capability index >1.25. Operations Management Simulation: Quality Analytics Control Limits UCLX=X+ARLCLX=XA,R UCLR=DRLCLR=D,R "rocess Capability 1. Use visual inspection to determine whether the process mean is centered between the specification limits. 2. Calculate the process capability index. a. Use C^p if the process mean is centered between the specification limits. C^p=6aUSLLSL b. Use Cpk if the process mean is not centered between the specification limits. C^pk=min[3USL,3^USL] USL = Upper specifleation linlt LSL = Lower specifilcation llmit A^= Proceco mean, which 10 the centerline between the UCL and LCL. This can be caleulated by adding the UCL and LCL, then dividing by 2 = Process standard deviation, whech can be calculated from the control limito, as follows. Calculate the proceso standard error as the difference between elther of the control limils and the proceso mean, divided by 3 . Then, calculate the process standard deviation by multiplying the process otandard exror by n. 3. Higher values of C^p and C^pk indicate a more capable process. Experts recommend a process capability index of at least 1.33 for a two-sided specification. For a one-sided specification that consists of an upper linut only (for example, concentration) or a lower limit only (for example, for strength), the process is considered capable if the process capability index >1.25Step by Step Solution
There are 3 Steps involved in it
1 Expert Approved Answer
Step: 1 Unlock

Question Has Been Solved by an Expert!
Get step-by-step solutions from verified subject matter experts
Step: 2 Unlock
Step: 3 Unlock