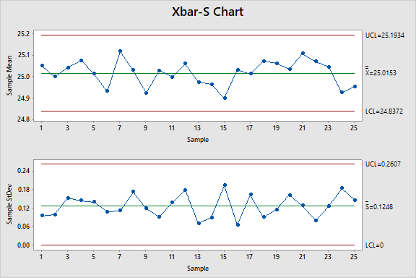
Question: Calculate the C p , C pu, and C pl for the Xbar/s chart using the Specification Limits of USL = 25.2 and LSL =

Calculate the C p , C pu, and C pl for the Xbar/s

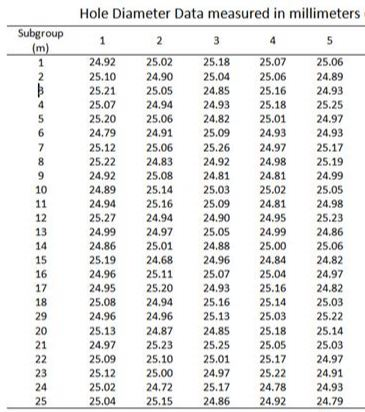
Calculate the Cp, Cpu, and Cpl for the Xbar/s chart using the Specification Limits of USL = 25.2 and LSL = 24.8. Comment on the interpretation of the Cp and the resulting Cpk that you additionally calculate. (Review the material in the previous modules PowerPoint on how to get an estimate of s.)

Calculate the C p , C pu, and C pl for the Xbar/s

Subgroup (m) 1 2 B 4 5 6 7 8 9 10 11 12 13 14 15 16 17 18 29 20 21 22 23 24 25 Hole Diameter Data measured in millimeters 1 2 3 4 5 24.92 25.02 25.18 25.07 25.06 25.10 24.90 25.04 25.06 24.89 25.21 25.05 24.85 25.16 24.93 25.07 24.94 24.93 25.18 25.25 25.20 25.06 24.82 25.01 24.97 24.79 24.91 25.09 24.93 24.93 25.12 25.06 25.26 24.97 25.17 25.22 24.83 24.92 24.98 25.19 24.92 25.08 24.81 24.81 24.99 24.89 25.14 25.03 25.02 25.05 24.94 25.16 25.09 24.81 24.98 25.27 24.94 24.90 24.95 25.23 24.99 24.97 25.05 24.99 24.86 24.86 25.01 24.88 25.00 25.06 25.19 24.68 24.96 24.84 24.82 24.96 25.11 25.07 25.04 24.97 24.95 25.20 24.93 25.16 24.82 25.08 24.94 25.16 25.14 25.03 24.96 24.96 25.13 25.03 25.22 25.13 24.87 24.85 25.18 25.14 24.97 25.23 25.25 25.05 25.03 25.09 25.10 25.01 25.17 24.97 25.12 25.00 24.97 25.22 24.91 25.02 24.72 25.17 24.78 24.93 25.04 25.15 24.86 24.92 24.79 Xbar-S Chart 25.2 UCL-25.1934 25.1 Sample Mean 3.-25.0153 25.0 24.9 LCL-24 372 24.3 1 3 5 7 9 11 15 17 19 21 23 25 13 Sample UCL=0.2607 0.24 0.18 Sample Stev 5:0.1245 LCL-D - 3 5 -- on 11 17 1921 13 15 Sample 2325

Step by Step Solution

There are 3 Steps involved in it

1 Expert Approved Answer
Step: 1 Unlock blur-text-image
Question Has Been Solved by an Expert!

Get step-by-step solutions from verified subject matter experts

Step: 2 Unlock
Step: 3 Unlock

Students Have Also Explored These Related General Management Questions!