

Question: Calculate the cash conversion cycle for 2010, 2011, and 2012 using the annual data provided in the balance sheet. UV6895 -7 Exhibit I J. C.
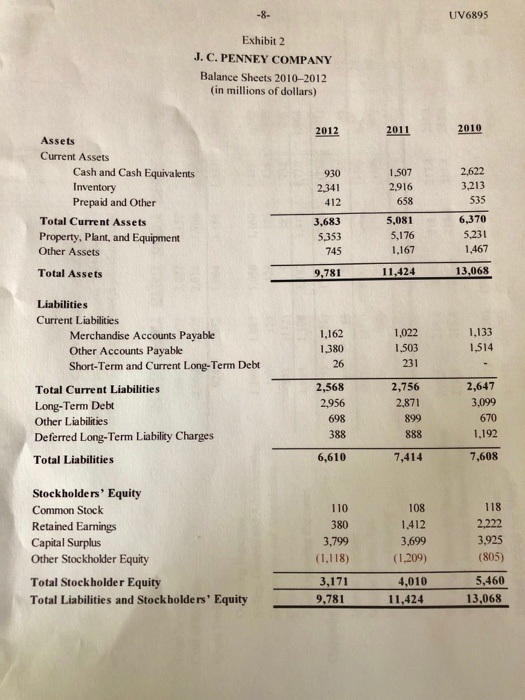
Calculate the cash conversion cycle for 2010, 2011, and 2012 using the annual data provided in the balance sheet. 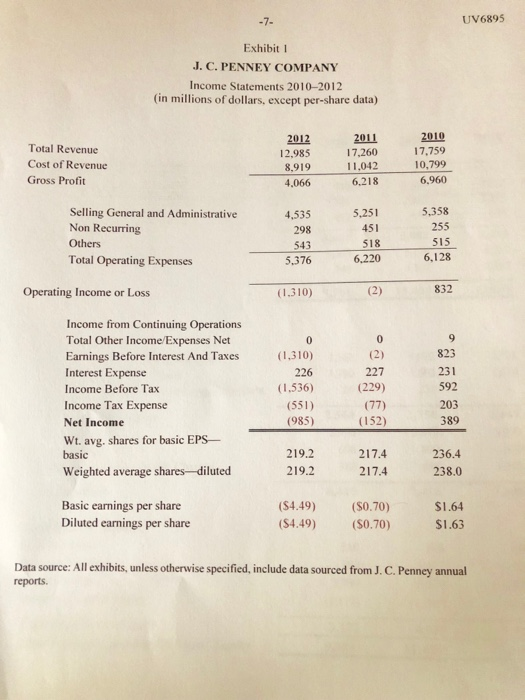
UV6895 -7 Exhibit I J. C. PENNEY COMPANY Income Statements 2010-2012 (in millions of dollars, except per-share data) 2010 Total Revenue Cost of Revenue Gross Profit 2012 12.985 8,919 4,066 2011 17,260 11.042 6,218 7.759 10,799 6,960 Selling General and Administrative Non Recurring Others Total Operating Expenses 5,358 255 515 6,128 5,251 451 4,535 298 543 5,376 518 832 Operating Income or Loss (1.310) Income from Continuing Operations Total Other Income/Expenses Net 0 Interest Expense Income Before Tax Income Tax Expense Net Income Wt. avg. shares for basic EPS Earnings Before Interest And Taxes310) 226 (1,536) (551) (985) 227 (229) (77) (152) 823 231 592 203 389 219.2 219.2 217.4 217.4 236.4 238.0 basic Weighted average shares diluted Basic earnings per share Diluted earnings per share $1.64 $1.63 (S4.49) (S0.70) (S4.49) (S0.70) Data source: All exhibits, unless otherwise specified, include data sourced from J. C. Penney annual
Step by Step Solution
There are 3 Steps involved in it

Get step-by-step solutions from verified subject matter experts