

Question: Calculate the Equity Value of Innovaccer Analytics using pseudo-DCF method. You have been provided the historical financials of Innovaccer Analytics. Please project the P&L, Balance
Calculate the Equity Value of Innovaccer Analytics using pseudo-DCF method.
You have been provided the historical financials of Innovaccer Analytics.
Please project the P&L, Balance Sheet, and Free Cashflow to Equity for the next 5 years (i.e. FY20 to FY24). The Cost of Equity for high-growth period is given as 35% and in the constant growth period at 15%.
Key Assumptions (Note: You are free to make any additional assumptions for their projections, which should be clearly specified in your submission):
- Revenue is expected to grow at 50% CAGR for next 5 years
- EBITDA margins are expected to increase by 2 percentage points each year (e.g. If the EBITDA margin is 20% in FY19, then it will be 22% in FY21
- Net Working Capital Days are expected to remain constant
- Total Asset to Revenue Ratio is expected to remain constant
- No dividends are expected to be paid in the next 5 years
- Free Cashflow is expected to grow at 8% in year 6 and onwards (i.e. in the first year of long-term growth phage)
Calculate the Equity Value of Innovaccer Analytics using pseudo-DCF method.
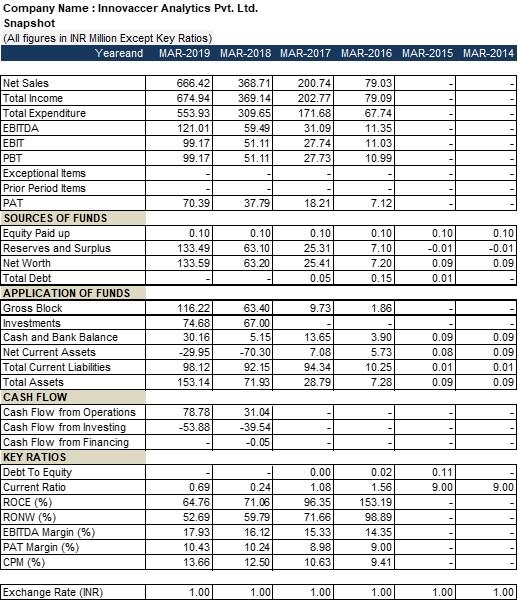
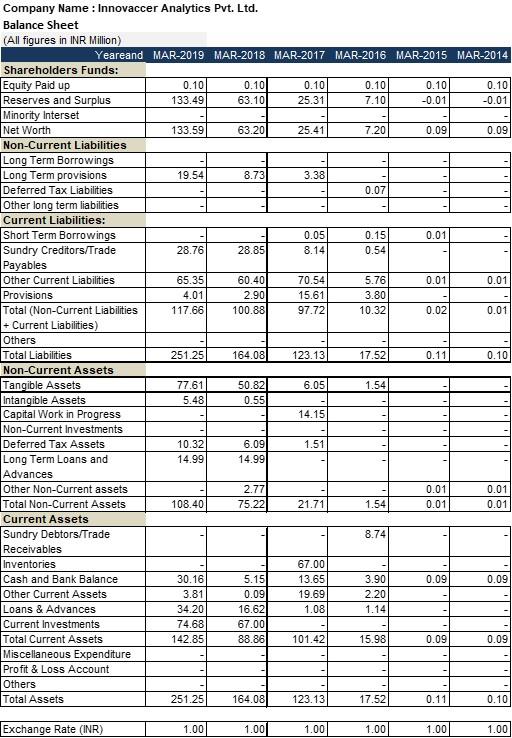
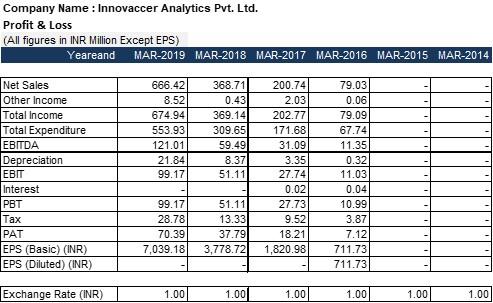
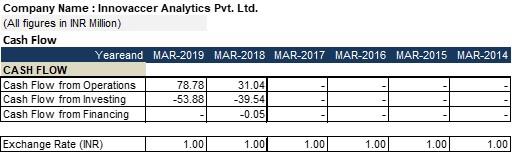
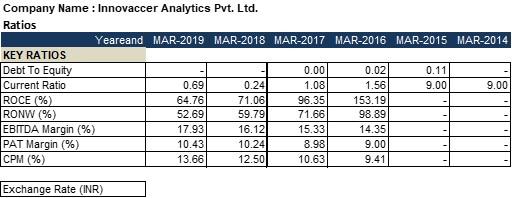
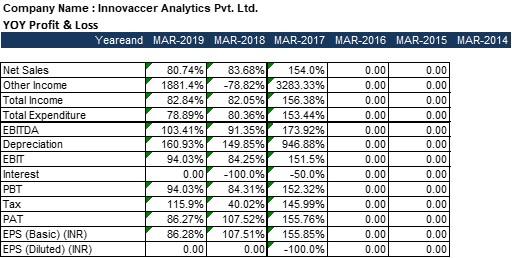
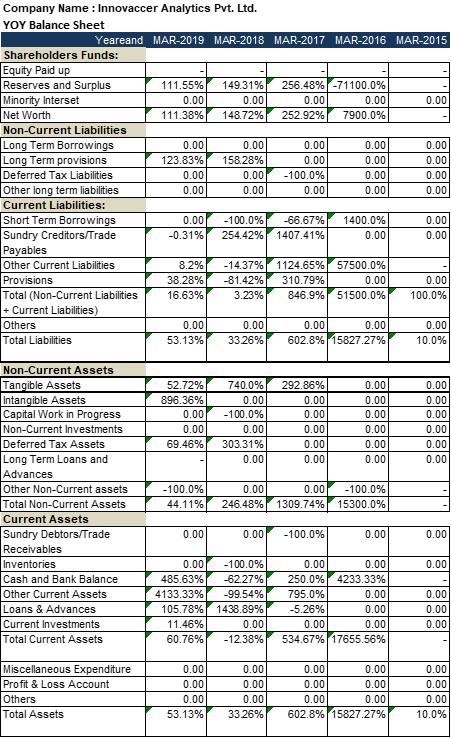
Company Name : Innovaccer Analytics Pvt. Ltd. Snapshot (All figures in INR Million Except Key Ratios) Yeareand MAR-2019 MAR-2018 MAR-2017 MAR-2016 MAR-2015 MAR-2014 666.42 674.94 553.93 121.01 99.17 99.17 368.71 369.14 309.65 59.49 51.11 51.11 200.74 202.77 171.68 31.09 27.74 27.73 79.03 79.09 67.74 11.35 11.03 10.99 70.39 37.79 18.21 7.12 0.10 133.49 133.59 0.10 63.10 63.20 0.10 25.31 25.41 0.05 0.10 7.10 7.20 0.15 0.10 -0.01 0.09 0.01 0.10 -0.01 0.09 9.73 1.86 Net Sales Total Income Total Expenditure EBITDA EBIT PBT Exceptional Items Prior Period Items PAT SOURCES OF FUNDS Equity Paid up Reserves and Surplus Net Worth Total Debt APPLICATION OF FUNDS Gross Block Investments Cash and Bank Balance Net Current Assets Total Current Liabilities Total Assets CASH FLOW Cash Flow from Operations Cash Flow from Investing Cash Flow from Financing KEY RATIOS Debt To Equity Current Ratio ROCE (%) RONW (%) EBITDA Margin (%) PAT Margin (%) CPM (%) 116.22 74.68 30.16 -29.95 98.12 153.14 63.40 67.00 5.151 -70.301 92.15 71.93 13.65 7.08 94.34 28.79 3.90 5.73 10.25 0.09 0.08 0.01 0.09 0.09 0.09 0.01 0.09 7.28 78.78 -53.88 31.04 -39.54 -0.05 0.11 9.00 9.00 0.69 64.76 52.69 17.93 10.43 13.66 0.24 71.06 59.79 16.12 10.24 12.50 0.00 1.08 96.35 71.66 15.33 8.98 10.63 0.02 1.56 153.19 98.89 14.35 9.00 9.41 Exchange Rate (INR) 1.00 1.00 1.00 1.00 1.00 1.00 Company Name : Innovaccer Analytics Pvt. Ltd. Balance Sheet (All figures in INR Million) Yeareand MAR-2019 MAR-2018 MAR-2017 MAR-2016 MAR-2015 MAR-2014 Shareholders Funds: Equity Paid up 0.10 0.10 0.10 0.10 0.10 0.10 Reserves and Surplus 133.49 63.10 25.31 7.10 -0.01 -0.01 Minority Interset Net Worth 133.59 63.20 25.41 7.20 0.09 0.09 Non-Current Liabilities Long Term Borrowings Long Term provisions 19.54 8.73 3.38 Deferred Tax Liabilities 0.07 Other long term liabilities Current Liabilities: Short Term Borrowings 0.05 0.15 0.01 Sundry Creditors/Trade 28.76 28.85 8.141 0.54 Payables Other Current Liabilities 65.35 60.40 70.54 5.76 0.01 0.01 Provisions 4.01 2.90 15.61 3.80 Total (Non-Current Liabilities 117.66 100.88 97.72 10.32 0.02 0.01 + Current Liabilities) Others Total Liabilities 251.25 164.08 123.13 17.52 0.11 0.10 Non-Current Assets Tangible Assets 77.61 50.82 6.05 1.54 Intangible Assets 5.48 0.55 Capital Work in Progress 14.15 Non-Current Investments Deferred Tax Assets 10.32 6.09 1.51 Long Term Loans and 14.99 14.991 Advances Other Non-Current assets 2.77 0.01 0.01 Total Non-Current Assets 108.40 75.22 21.71 1.54 0.01 0.01 Current Assets Sundry Debtors/Trade 8.74 Receivables Inventories 67.00 Cash and Bank Balance 30.16 5.15 13.65 3.90 0.09 0.09 Other Current Assets 3.81 0.09 19.69 2.20 Loans & Advances 34.20 16.62 1.08 1.14 Current Investments 74.68 67.00 Total Current Assets 142.85 88.86 101.42 15.98 0.09 0.09 Miscellaneous Expenditure Profit & Loss Account Others Total Assets 251.25 164.08 123.13 17.52 0.11 0.10 Exchange Rate (INR) 1.00 1.001 1.00 1.001 1.00 1.00 Company Name : Innovaccer Analytics Pvt. Ltd. Profit & Loss (All figures in INR Million Except EPS) Yeareand MAR-2019 MAR-2018 MAR-2017 MAR-2016 MAR-2015 MAR-2014 Net Sales Other Income Total Income Total Expenditure EBITDA Depreciation EBIT Interest PBT 666.42) 8.52 674.94 553.93 121.01 21.84 99.17 368.71 0.43 369.14 309.65 59.49 8.37 51.11 200.74 2.03 202.77 171.68 31.09 3.35 27.74 0.02 27.73 9.52 18.21 1,820.98 79.03 0.06 79.09 67.74 11.35 0.32 11.03 0.04 10.99 3.87 7.12 711.73 711.73 Tax 99.17 28.78 70.39 7,039.18 51.11 13.33 37.79 3,778.72 PAT EPS (Basic) (INR) EPS (Diluted) (INR) Exchange Rate (INR) 1.00 1.00 1.00 1.00 1.00 1.00 Company Name : Innovaccer Analytics Pvt. Ltd. (All figures in INR Million) Cash Flow Yeareand MAR-2019 MAR-2018 MAR-2017 MAR-2016 MAR-2015 MAR-2014 CASH FLOW Cash Flow from Operations 78.78 31.041 Cash Flow from Investing -53.88 -39.54 Cash Flow from Financing -0.05 Exchange Rate (INR) 1.00 1.00 1.00 1.00 1.00 1.00 Company Name : Innovaccer Analytics Pvt. Ltd. Ratios Yeareand MAR-2019 MAR-2018 MAR-2017 MAR-2016 MAR-2015 MAR-2014 KEY RATIOS Debt To Equity 0.00 0.02 0.11 Current Ratio 0.69 0.24 1.08 1.56 9.00 9.00 ROCE (%) 64.76 71.06 96.35 153.19 RONW (%) 52.69 59.79 71.66 98.89 EBITDA Margin (%) 17.93 16.12 15.33 14.35 PAT Margin (%) 10.43 10.24 8.98 9.00 CPM (%) 13.66 12.50 10.63 9.41 Exchange Rate (INR) Company Name : Innovaccer Analytics Pvt. Ltd. YOY Profit & Loss Yeareand MAR-2019 MAR-2018 MAR-2017 MAR-2016 MAR-2015 MAR-2014 Net Sales Other Income Total Income Total Expenditure EBITDA Depreciation EBIT Interest PBT Tax PAT EPS (Basic) (INR) EPS (Diluted) (INR) 80.74% 1881.4% 82.84% 78.89% 103.41% 160.93% 94.03% 0.00 94.03% 115.9% 86.27% 86.28% 0.00 83.68% 154.0% -78.82% 3283.33% 82.05% 156.38% 80.36% 153.44% 91.35% 173.92% 149.85% 946.88% 84.25% 151.5% -100.0% -50.0% 84.31% 152.32% 40.02% 145.99% 107.52% 155.76% 107.51% 155.85% 0.00 -100.0% 0.00 0.00 0.00 0.00 0.00 0.00 0.00 0.00 0.00 0.00 0.00 0.00 0.00 0.00 0.00 0.00 0.00 0.00 0.00 0.00 0.00 0.00 0.00 0.00 0.00 0.00 1111 Company Name : Innovaccer Analytics Pvt. Ltd. YOY Balance Sheet Yeareand MAR-2019 MAR-2018 MAR-2017 MAR-2016 MAR-2015 Shareholders Funds: Equity Paid up Reserves and Surplus 111.55% 149.31% 256.48% -71100.0% Minority Interset 0.00 0.00 0.00 0.00 0.00 Net Worth 111.38% 148.72% 252.92% 7900.0% Non-Current Liabilities Long Term Borrowings 0.00 0.00 0.00 0.00 0.00 Long Term provisions 123.83% 158.28% 0.00 0.00 0.00 Deferred Tax Liabilities 0.00 0.00 -100.0% 0.00 0.00 Other long term liabilities 0.00 0.00 0.00 0.00 0.00 Current Liabilities: Short Term Borrowings 0.00 -100.0% -66.67% 1400.0% 0.00 Sundry Creditors/Trade -0.31% 254.42% 1407.41% 0.00 0.00 Payables Other Current Liabilities 8.2% -14.37% 1124.65% 57500.0% Provisions 38.28% -81.42% 310.79% 0.00 0.00 Total (Non-Current Liabilities 16.63% 3.23% 846.9% 51500.0% 100.0% + Current Liabilities) Others 0.00 0.00 0.00 0.00 0.00 Total Liabilities 53.13% 33 26% 602.8% 15827.27% 10.0% 52.72% 896.36% 0.00 0.00 69.46% 740.0% 0.00 -100.0% 0.00 303.31% 0.00 292.86% 0.00 0.00 0.00 0.00 0.00 0.00 0.00 0.00 0.00 0.00 0.00 0.00 0.00 0.00 0.00 0.00 0.00 Non-Current Assets Tangible Assets Intangible Assets Capital Work in Progress Non-Current Investments Deferred Tax Assets Long Term Loans and Advances Other Non-Current assets Total Non-Current Assets Current Assets Sundry Debtors/Trade Receivables Inventories Cash and Bank Balance Other Current Assets Loans & Advances Current Investments Total Current Assets -100.0% 44.11% 0.00 246.48% 0.00 -100.0% 1309.74% 15300.0% 0.00 0.00 -100.0% 0.00 0.00 0.00 0.00 -100.0% 485.63% -62.27% 4133.33% -99.54% 105.78% 1438.89% 11.46% 0.00 60.76% -12.38% 0.00 0.00 250.0% 4233.33% 795.0% 0.00 -5.26% 0.00 0.00 0.00 534.67% 17655.56% 0.00 0.00 0.00 Miscellaneous Expenditure Profit & Loss Account Others Total Assets 0.00 0.00 0.00 53.13% 0.00 0.001 0.00 33 26% 0.00 0.00 0.00 0.00 0.00 0.00 602.8% 15827.27% 0.00 0.00 0.00 10.0% Company Name : Innovaccer Analytics Pvt. Ltd. Snapshot (All figures in INR Million Except Key Ratios) Yeareand MAR-2019 MAR-2018 MAR-2017 MAR-2016 MAR-2015 MAR-2014 666.42 674.94 553.93 121.01 99.17 99.17 368.71 369.14 309.65 59.49 51.11 51.11 200.74 202.77 171.68 31.09 27.74 27.73 79.03 79.09 67.74 11.35 11.03 10.99 70.39 37.79 18.21 7.12 0.10 133.49 133.59 0.10 63.10 63.20 0.10 25.31 25.41 0.05 0.10 7.10 7.20 0.15 0.10 -0.01 0.09 0.01 0.10 -0.01 0.09 9.73 1.86 Net Sales Total Income Total Expenditure EBITDA EBIT PBT Exceptional Items Prior Period Items PAT SOURCES OF FUNDS Equity Paid up Reserves and Surplus Net Worth Total Debt APPLICATION OF FUNDS Gross Block Investments Cash and Bank Balance Net Current Assets Total Current Liabilities Total Assets CASH FLOW Cash Flow from Operations Cash Flow from Investing Cash Flow from Financing KEY RATIOS Debt To Equity Current Ratio ROCE (%) RONW (%) EBITDA Margin (%) PAT Margin (%) CPM (%) 116.22 74.68 30.16 -29.95 98.12 153.14 63.40 67.00 5.151 -70.301 92.15 71.93 13.65 7.08 94.34 28.79 3.90 5.73 10.25 0.09 0.08 0.01 0.09 0.09 0.09 0.01 0.09 7.28 78.78 -53.88 31.04 -39.54 -0.05 0.11 9.00 9.00 0.69 64.76 52.69 17.93 10.43 13.66 0.24 71.06 59.79 16.12 10.24 12.50 0.00 1.08 96.35 71.66 15.33 8.98 10.63 0.02 1.56 153.19 98.89 14.35 9.00 9.41 Exchange Rate (INR) 1.00 1.00 1.00 1.00 1.00 1.00 Company Name : Innovaccer Analytics Pvt. Ltd. Balance Sheet (All figures in INR Million) Yeareand MAR-2019 MAR-2018 MAR-2017 MAR-2016 MAR-2015 MAR-2014 Shareholders Funds: Equity Paid up 0.10 0.10 0.10 0.10 0.10 0.10 Reserves and Surplus 133.49 63.10 25.31 7.10 -0.01 -0.01 Minority Interset Net Worth 133.59 63.20 25.41 7.20 0.09 0.09 Non-Current Liabilities Long Term Borrowings Long Term provisions 19.54 8.73 3.38 Deferred Tax Liabilities 0.07 Other long term liabilities Current Liabilities: Short Term Borrowings 0.05 0.15 0.01 Sundry Creditors/Trade 28.76 28.85 8.141 0.54 Payables Other Current Liabilities 65.35 60.40 70.54 5.76 0.01 0.01 Provisions 4.01 2.90 15.61 3.80 Total (Non-Current Liabilities 117.66 100.88 97.72 10.32 0.02 0.01 + Current Liabilities) Others Total Liabilities 251.25 164.08 123.13 17.52 0.11 0.10 Non-Current Assets Tangible Assets 77.61 50.82 6.05 1.54 Intangible Assets 5.48 0.55 Capital Work in Progress 14.15 Non-Current Investments Deferred Tax Assets 10.32 6.09 1.51 Long Term Loans and 14.99 14.991 Advances Other Non-Current assets 2.77 0.01 0.01 Total Non-Current Assets 108.40 75.22 21.71 1.54 0.01 0.01 Current Assets Sundry Debtors/Trade 8.74 Receivables Inventories 67.00 Cash and Bank Balance 30.16 5.15 13.65 3.90 0.09 0.09 Other Current Assets 3.81 0.09 19.69 2.20 Loans & Advances 34.20 16.62 1.08 1.14 Current Investments 74.68 67.00 Total Current Assets 142.85 88.86 101.42 15.98 0.09 0.09 Miscellaneous Expenditure Profit & Loss Account Others Total Assets 251.25 164.08 123.13 17.52 0.11 0.10 Exchange Rate (INR) 1.00 1.001 1.00 1.001 1.00 1.00 Company Name : Innovaccer Analytics Pvt. Ltd. Profit & Loss (All figures in INR Million Except EPS) Yeareand MAR-2019 MAR-2018 MAR-2017 MAR-2016 MAR-2015 MAR-2014 Net Sales Other Income Total Income Total Expenditure EBITDA Depreciation EBIT Interest PBT 666.42) 8.52 674.94 553.93 121.01 21.84 99.17 368.71 0.43 369.14 309.65 59.49 8.37 51.11 200.74 2.03 202.77 171.68 31.09 3.35 27.74 0.02 27.73 9.52 18.21 1,820.98 79.03 0.06 79.09 67.74 11.35 0.32 11.03 0.04 10.99 3.87 7.12 711.73 711.73 Tax 99.17 28.78 70.39 7,039.18 51.11 13.33 37.79 3,778.72 PAT EPS (Basic) (INR) EPS (Diluted) (INR) Exchange Rate (INR) 1.00 1.00 1.00 1.00 1.00 1.00 Company Name : Innovaccer Analytics Pvt. Ltd. (All figures in INR Million) Cash Flow Yeareand MAR-2019 MAR-2018 MAR-2017 MAR-2016 MAR-2015 MAR-2014 CASH FLOW Cash Flow from Operations 78.78 31.041 Cash Flow from Investing -53.88 -39.54 Cash Flow from Financing -0.05 Exchange Rate (INR) 1.00 1.00 1.00 1.00 1.00 1.00 Company Name : Innovaccer Analytics Pvt. Ltd. Ratios Yeareand MAR-2019 MAR-2018 MAR-2017 MAR-2016 MAR-2015 MAR-2014 KEY RATIOS Debt To Equity 0.00 0.02 0.11 Current Ratio 0.69 0.24 1.08 1.56 9.00 9.00 ROCE (%) 64.76 71.06 96.35 153.19 RONW (%) 52.69 59.79 71.66 98.89 EBITDA Margin (%) 17.93 16.12 15.33 14.35 PAT Margin (%) 10.43 10.24 8.98 9.00 CPM (%) 13.66 12.50 10.63 9.41 Exchange Rate (INR) Company Name : Innovaccer Analytics Pvt. Ltd. YOY Profit & Loss Yeareand MAR-2019 MAR-2018 MAR-2017 MAR-2016 MAR-2015 MAR-2014 Net Sales Other Income Total Income Total Expenditure EBITDA Depreciation EBIT Interest PBT Tax PAT EPS (Basic) (INR) EPS (Diluted) (INR) 80.74% 1881.4% 82.84% 78.89% 103.41% 160.93% 94.03% 0.00 94.03% 115.9% 86.27% 86.28% 0.00 83.68% 154.0% -78.82% 3283.33% 82.05% 156.38% 80.36% 153.44% 91.35% 173.92% 149.85% 946.88% 84.25% 151.5% -100.0% -50.0% 84.31% 152.32% 40.02% 145.99% 107.52% 155.76% 107.51% 155.85% 0.00 -100.0% 0.00 0.00 0.00 0.00 0.00 0.00 0.00 0.00 0.00 0.00 0.00 0.00 0.00 0.00 0.00 0.00 0.00 0.00 0.00 0.00 0.00 0.00 0.00 0.00 0.00 0.00 1111 Company Name : Innovaccer Analytics Pvt. Ltd. YOY Balance Sheet Yeareand MAR-2019 MAR-2018 MAR-2017 MAR-2016 MAR-2015 Shareholders Funds: Equity Paid up Reserves and Surplus 111.55% 149.31% 256.48% -71100.0% Minority Interset 0.00 0.00 0.00 0.00 0.00 Net Worth 111.38% 148.72% 252.92% 7900.0% Non-Current Liabilities Long Term Borrowings 0.00 0.00 0.00 0.00 0.00 Long Term provisions 123.83% 158.28% 0.00 0.00 0.00 Deferred Tax Liabilities 0.00 0.00 -100.0% 0.00 0.00 Other long term liabilities 0.00 0.00 0.00 0.00 0.00 Current Liabilities: Short Term Borrowings 0.00 -100.0% -66.67% 1400.0% 0.00 Sundry Creditors/Trade -0.31% 254.42% 1407.41% 0.00 0.00 Payables Other Current Liabilities 8.2% -14.37% 1124.65% 57500.0% Provisions 38.28% -81.42% 310.79% 0.00 0.00 Total (Non-Current Liabilities 16.63% 3.23% 846.9% 51500.0% 100.0% + Current Liabilities) Others 0.00 0.00 0.00 0.00 0.00 Total Liabilities 53.13% 33 26% 602.8% 15827.27% 10.0% 52.72% 896.36% 0.00 0.00 69.46% 740.0% 0.00 -100.0% 0.00 303.31% 0.00 292.86% 0.00 0.00 0.00 0.00 0.00 0.00 0.00 0.00 0.00 0.00 0.00 0.00 0.00 0.00 0.00 0.00 0.00 Non-Current Assets Tangible Assets Intangible Assets Capital Work in Progress Non-Current Investments Deferred Tax Assets Long Term Loans and Advances Other Non-Current assets Total Non-Current Assets Current Assets Sundry Debtors/Trade Receivables Inventories Cash and Bank Balance Other Current Assets Loans & Advances Current Investments Total Current Assets -100.0% 44.11% 0.00 246.48% 0.00 -100.0% 1309.74% 15300.0% 0.00 0.00 -100.0% 0.00 0.00 0.00 0.00 -100.0% 485.63% -62.27% 4133.33% -99.54% 105.78% 1438.89% 11.46% 0.00 60.76% -12.38% 0.00 0.00 250.0% 4233.33% 795.0% 0.00 -5.26% 0.00 0.00 0.00 534.67% 17655.56% 0.00 0.00 0.00 Miscellaneous Expenditure Profit & Loss Account Others Total Assets 0.00 0.00 0.00 53.13% 0.00 0.001 0.00 33 26% 0.00 0.00 0.00 0.00 0.00 0.00 602.8% 15827.27% 0.00 0.00 0.00 10.0%
Step by Step Solution
There are 3 Steps involved in it

Get step-by-step solutions from verified subject matter experts