

Question: . Calculate the estimated Interquartile range for the data? Question C2 The table below shows the distances (to the nearest km) travelled to work by
. Calculate the estimated Interquartile range for the data?
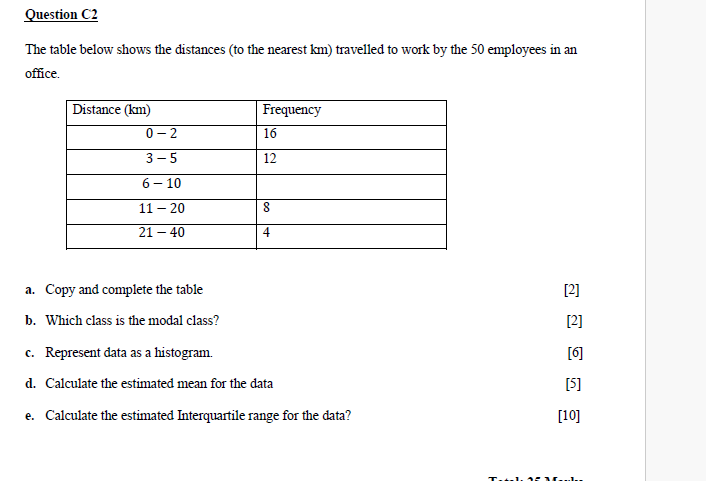
Question C2 The table below shows the distances (to the nearest km) travelled to work by the 50 employees in an office. Distance (km) Frequency 0-2 16 3-5 12 6 -10 11 - 20 8 21 - 40 4 a. Copy and complete the table 2] b. Which class is the modal class? [2] C. Represent data as a histogram. [6] d. Calculate the estimated mean for the data [5] e. Calculate the estimated Interquartile range for the data? [10]
Step by Step Solution
There are 3 Steps involved in it
1 Expert Approved Answer
Step: 1 Unlock

Question Has Been Solved by an Expert!
Get step-by-step solutions from verified subject matter experts
Step: 2 Unlock
Step: 3 Unlock