

Question: Calculate the expected values for the following data set and null hypothesis. Ho: The population is distributed in a ratio of 1:2:1 for the categories
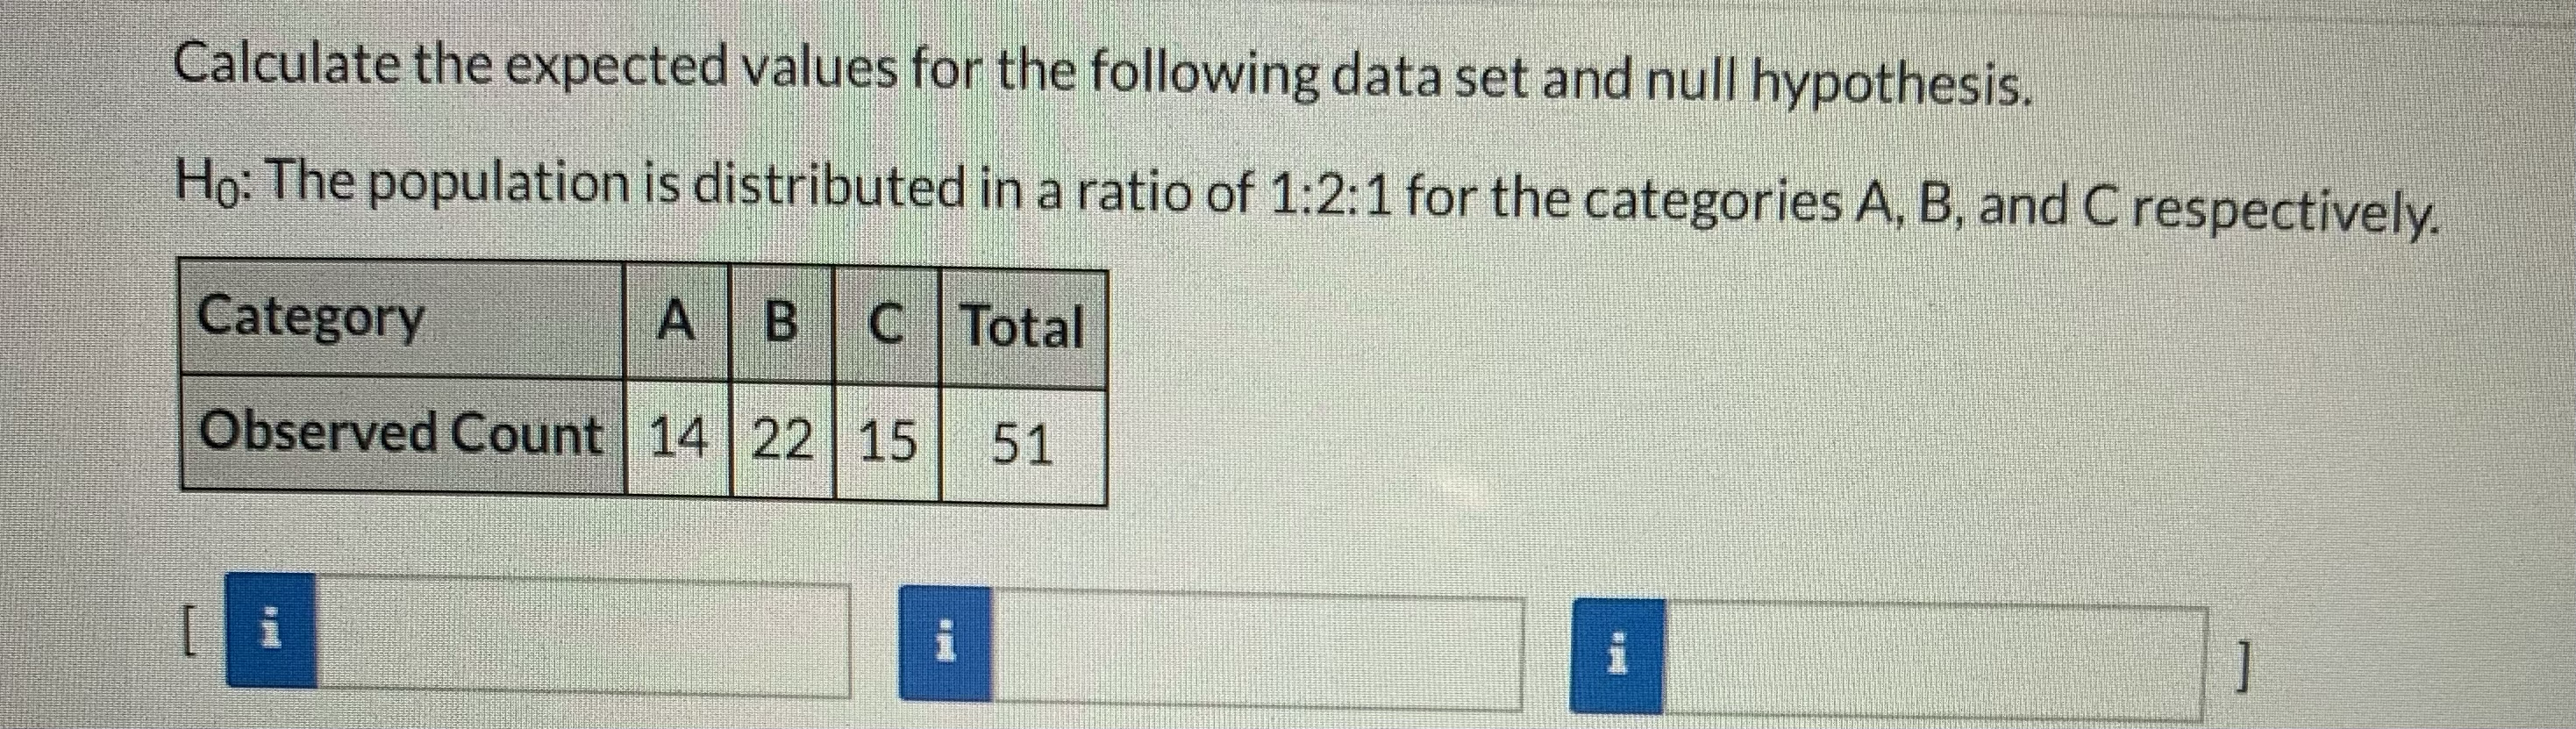
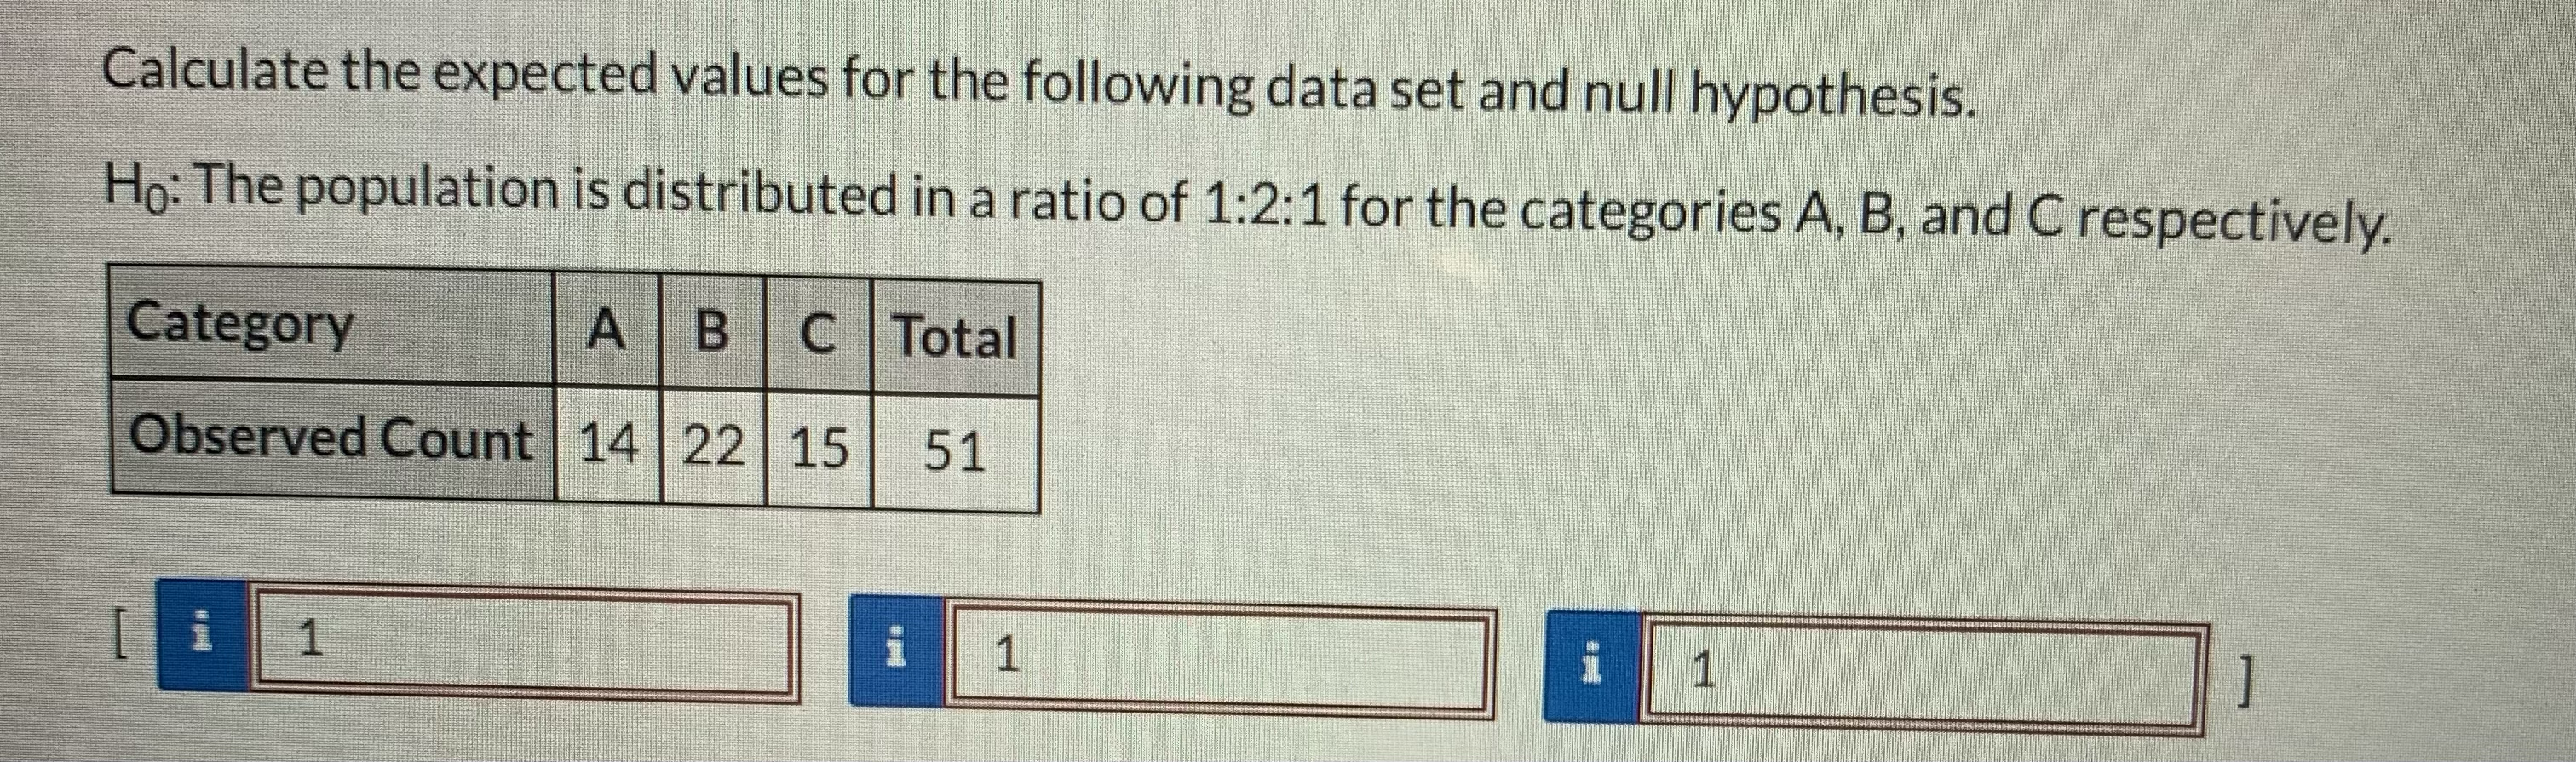

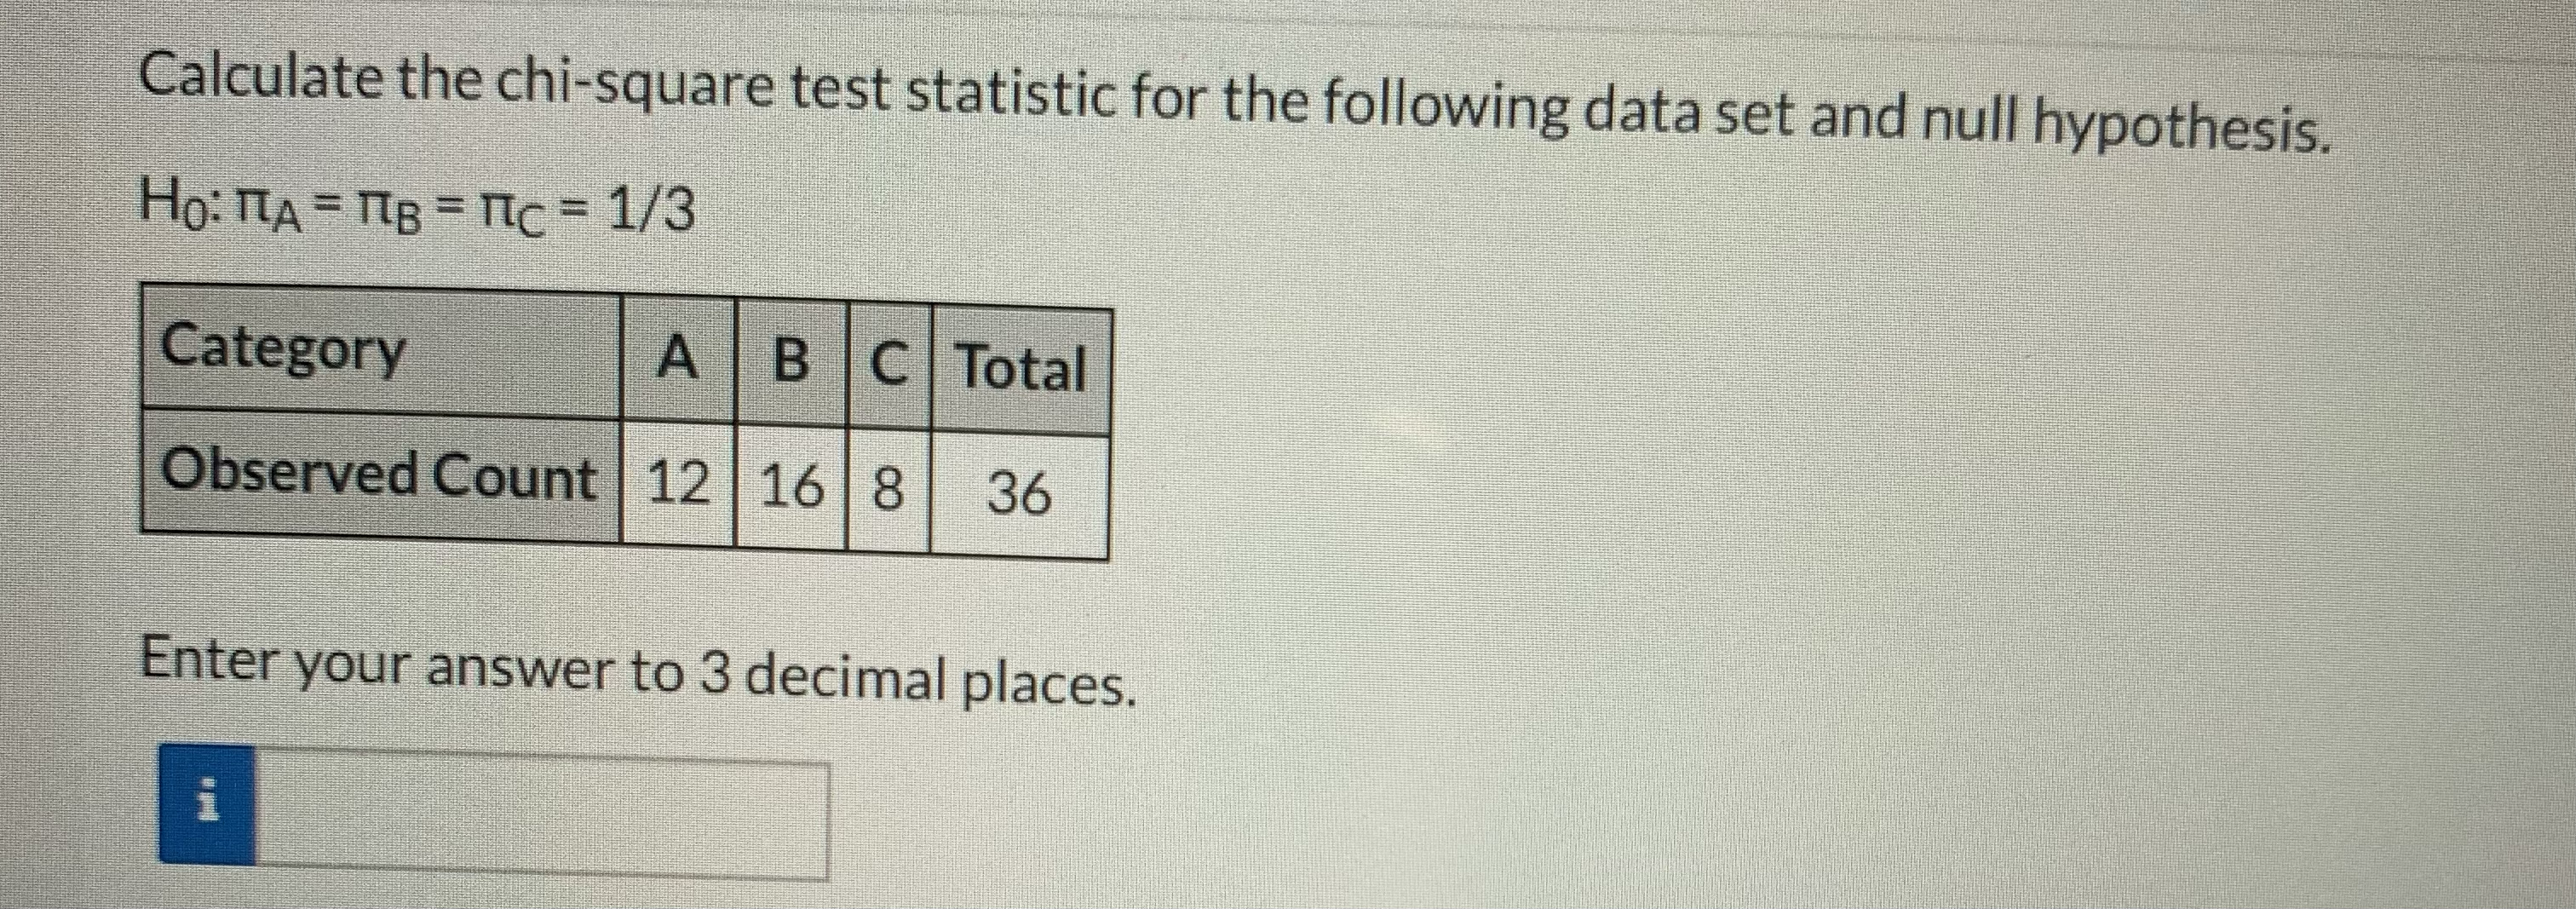
Calculate the expected values for the following data set and null hypothesis. Ho: The population is distributed in a ratio of 1:2:1 for the categories A, B, and C respectively. Category A B C Total Observed Count | 14 22 15 51Calculate the expected values for the following data set and null hypothesis. Ho: The population is distributed in a ratio of 1:2:1 for the categories A, B, and C respectively. Category A B C |Total Observed Count | 14 | 22 15 51 AIn addition to having dice pushed off a 2-inch ledge, as in the example in this section, the researchers also pushed dice off a four-inch- high ledge with the following results. Value 1 2 3 4 5 6 Observed 26 24 19 12 18 21 count Is this an unfair way to "roll" dice? In other words, is there strong evidence that the results will not be equally distributed in the long run? The p-value for the appropriate test statistic is Enter your answer to 3 decimal places. iCalculate the chi-square test statistic for the following data set and null hypothesis. Ho: TIA = MB = nc = 1/3 Category A B Total Observed Count 12 16 18 36 Enter your answer to 3 decimal places
Step by Step Solution
There are 3 Steps involved in it

Get step-by-step solutions from verified subject matter experts