

Question: Calculate the following data: Profitability Analysis: ROA = Return on Asset=Net Income / Total Asset Profit Margin = Net Income / sales. A/R Turnover =
Calculate the following data:
- Profitability Analysis:
- ROA = Return on Asset=Net Income / Total Asset
- Profit Margin = Net Income / sales.
- A/R Turnover = Net Sales on Account / Average Account Receivable
Average Account Receivable = Trade and other Receivables 2017 + Trade and other Receivables 2018 / 2
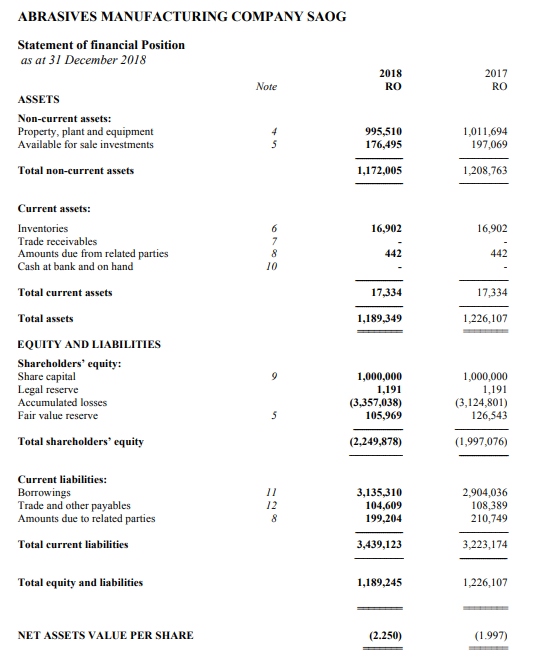
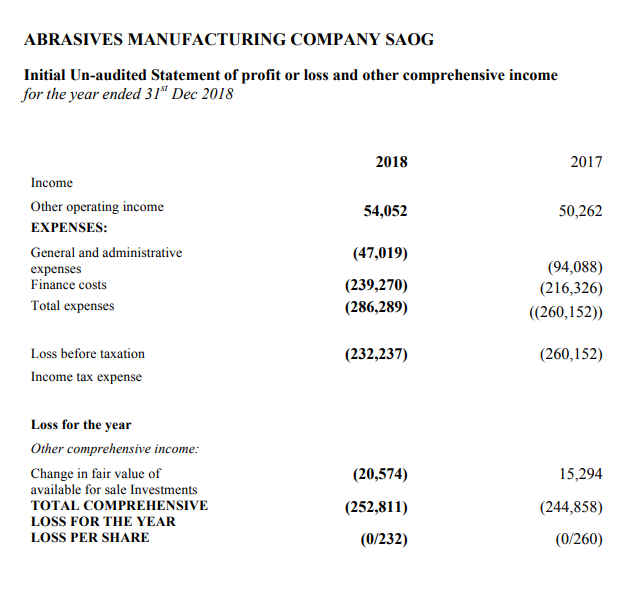
ABRASIVES MANUFACTURING COMPANY SAOG Statement of financial Position as at 31 December 2018 2018 RO 2017 RO Note + ASSETS Non-current assets: Property, plant and equipment Available for sale investments Total non-current assets 995,510 176,495 1,011,694 197,069 1,172,005 1,208,763 16,902 16,902 6 7 8 10 442 442 17,334 Current assets: Inventories Trade receivables Amounts due from related parties Cash at bank and on hand Total current assets Total assets EQUITY AND LIABILITIES Shareholders' equity: Share capital Legal reserve Accumulated losses Fair value reserve Total shareholders' equity 17,334 1,189,349 1,226,107 9 1,000,000 1,191 (3.357,038) 105,969 1,000,000 1,191 (3,124,801) 126,543 5 (2.249,878) (1,997,076) Current liabilities: Borrowings Trade and other payables Amounts due to related parties Total current liabilities 12 8 3,135,310 104,609 199,204 2,904,036 108,389 210,749 3,439,123 3,223,174 Total equity and liabilities 1,189,245 1,226, 107 NET ASSETS VALUE PER SHARE (2.250) (1.997) ABRASIVES MANUFACTURING COMPANY SAOG Initial Un-audited Statement of profit or loss and other comprehensive income for the year ended 31" Dec 2018 2018 2017 54,052 50,262 Income Other operating income EXPENSES: General and administrative expenses Finance costs Total expenses (47,019) (239,270) (286,289) (94,088) (216,326) (260,152)) (232,237) (260,152) Loss before taxation Income tax expense Loss for the year Other comprehensive income: Change in fair value of available for sale Investments TOTAL COMPREHENSIVE LOSS FOR THE YEAR LOSS PER SHARE (20,574) 15,294 (252,811) (0/232) (244,858) (0/260)
Step by Step Solution
There are 3 Steps involved in it

Get step-by-step solutions from verified subject matter experts