

Question: Calculate the following data: Profitability Analysis: ROA. ROA = Return on Asset=Net Income / Total Asset = -252811/1189349 = -21.26% Profit Margin. Profit Margin =
Calculate the following data:
Profitability Analysis:
- ROA.
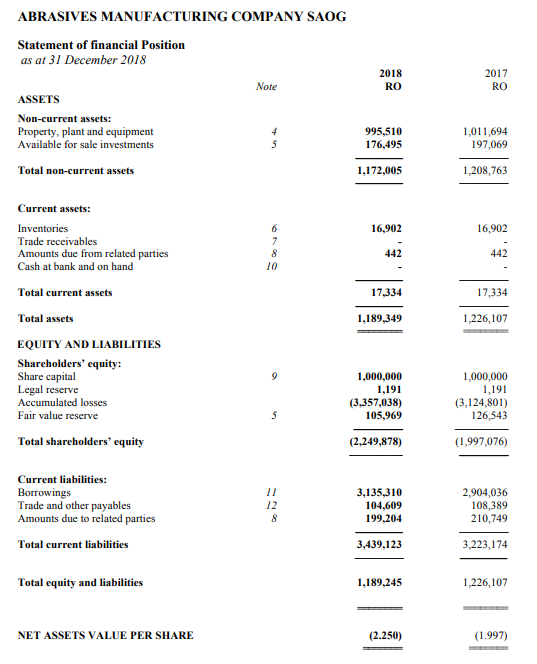
- ROA = Return on Asset=Net Income / Total Asset
= -252811/1189349 = -21.26%
- Profit Margin.
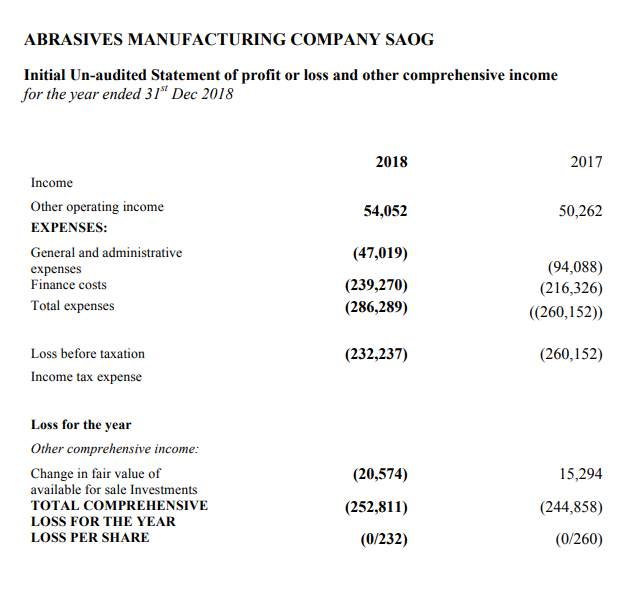
Profit Margin = Net Income / sales.
= -252811/54052 = -467.72%
- Assets Turnover.
A/R Turnover = Net Sales on Account / Average Account Receivable
= 54052/0 = No Answer (as the receivable balance is Nil, the ratio cannot be calculated
- ROCE Analysis
- ROCE.
ROCE computation = net income preferred dividends / average common shareholders
Relating ROA to ROCE = return to creditors + return to proffered stockholder + ROCE
Disaggregation of ROCE =
ROCE = ROA x Adjusted Leverage
net income / A.common shareholders
= net income / A.total assets x net income to common stock / net income x average total assets / A.Shareholders equity
CEL(Common earnings leverage) = Net income - Preferred dividends / Net income + ( 1 - ) x Interest expense + MI in earnings
CSL (Capital structure leverage) = Average total assets / Average common equity
- Risk Analysis:
Quick Ratio (Acid Test Ratio).
Quick ratio = cash + marteble security + recivable / current liabilities
- Working capital Activity ratio.
Working capital activity ratio = A/R TURNOVER = net sales on account / Average account recievable
- Inventory TURNOVER = cost of goods sold / Average inventory
- A/P TURNOVER = PURCHASE ( cost of sales + ENG.inventort - BEG. Inventory ) / Average account payable
- Long-Term Solvency Risk- Debt Ratios:
- L.T. Debt Ratio.
L.T Debt ratio = long term debt / long term debt + shareholders equity
- Debt/Equity Ratio.
Debt/ equity ratio = long term debt / shareholders equity
- L.T. Debt/Asset Ratio.
L.T Debt to assets ratio = long term debt / total Assets
- Multiple Discriminant Analysis:
- Altman's Z-Score.
Altman's Z-Score = [ 1.2 x net working capital / total assets ] + [ 1.4 x retained earning / total assets ] + [ 3.3 x Earning before tax and interest / total assets ] + [ 0.6 x M.V Equity / Total Assets ] + [ 1 x Sales / Total Assets ]
ABRASIVES MANUFACTURING COMPANY SAOG Statement of financial Position as at 31 December 2018 2018 RO 2017 RO Note + ASSETS Non-current assets: Property, plant and equipment Available for sale investments Total non-current assets 995,510 176,495 1,011,694 197,069 1,172,005 1,208,763 16,902 16,902 6 7 8 10 442 442 17,334 Current assets: Inventories Trade receivables Amounts due from related parties Cash at bank and on hand Total current assets Total assets EQUITY AND LIABILITIES Shareholders' equity: Share capital Legal reserve Accumulated losses Fair value reserve Total shareholders' equity 17,334 1,189,349 1,226,107 9 1,000,000 1,191 (3.357,038) 105,969 1,000,000 1,191 (3,124,801) 126,543 5 (2.249,878) (1,997,076) Current liabilities: Borrowings Trade and other payables Amounts due to related parties Total current liabilities 12 8 3,135,310 104,609 199,204 2,904,036 108,389 210,749 3,439,123 3,223,174 Total equity and liabilities 1,189,245 1,226, 107 NET ASSETS VALUE PER SHARE (2.250) (1.997) ABRASIVES MANUFACTURING COMPANY SAOG Initial Un-audited Statement of profit or loss and other comprehensive income for the year ended 31" Dec 2018 2018 2017 54,052 50,262 Income Other operating income EXPENSES: General and administrative expenses Finance costs Total expenses (47,019) (239,270) (286,289) (94,088) (216,326) (260,152)) (232,237) (260,152) Loss before taxation Income tax expense Loss for the year Other comprehensive income: Change in fair value of available for sale Investments TOTAL COMPREHENSIVE LOSS FOR THE YEAR LOSS PER SHARE (20,574) 15,294 (252,811) (0/232) (244,858) (0/260)
Step by Step Solution
There are 3 Steps involved in it

Get step-by-step solutions from verified subject matter experts