

Question: Calculate the following. Using the data below, evaluate Paneras financial position. Financial Analysis: Panera Bread Part 1: Financial Ratios Exhibit 1 in the Panera case
Calculate the following. Using the data below, evaluate Paneras financial position.
Financial Analysis: Panera Bread
Part 1: Financial Ratios
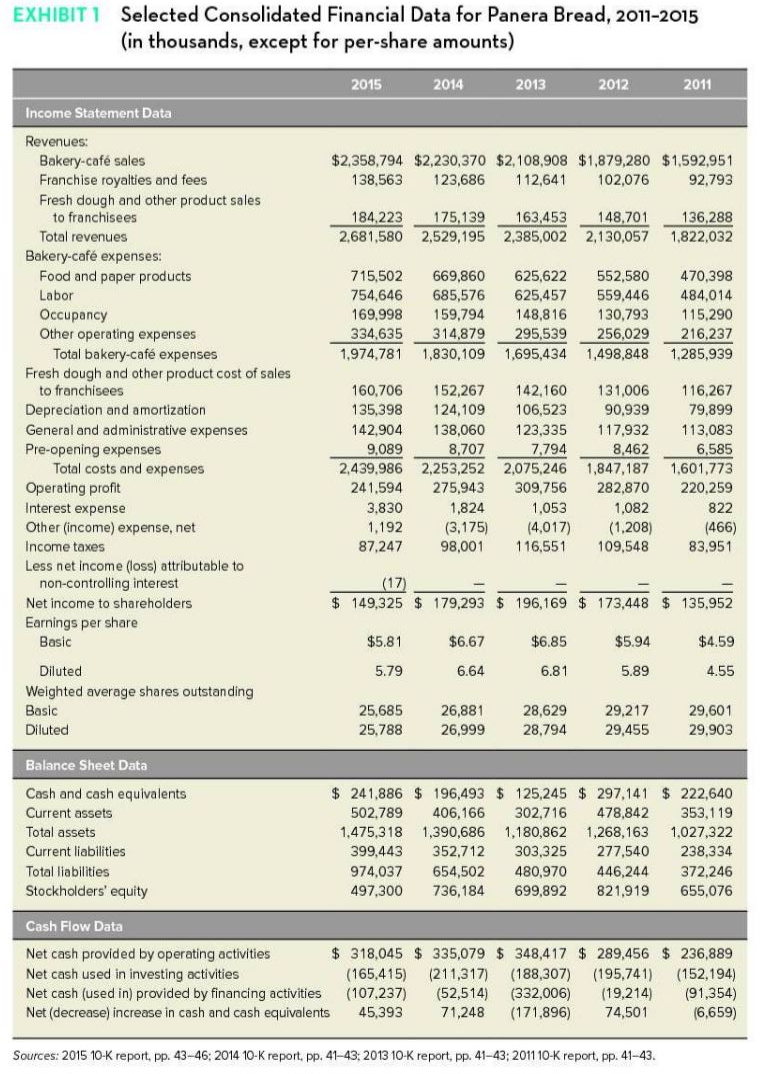
Exhibit 1 in the Panera case provides information on Paneras financial data for the years 2011 through 2015. Calculate the following operating and financial ratios for the years 2011 to 2015. All calculations should be rounded to one decimal (e.g., 12.7%).
| Financial ratios | 2015 | 2014 | 2013 | 2012 | 2011 |
| Total bakery caf expenses as a % of total revenues
|
|
|
|
|
|
| General and administrative expenses as a % of total revenues
|
|
|
|
|
|
| Operating profit as % of a total revenue (operating profit margin)
|
|
|
|
|
|
| Net income as a % of total revenue (net profit margin)
|
|
|
|
|
|
| Net income as a % of stockholders equity (ROE)
|
|
|
|
|
|
Part 2: Annual Growth Activity
Using available data in the case (exhibit 1), calculate the requested annual growth percentages. Round all numbers to the nearest hundredth.
All growth rates can be calculated using the following equation: [Year (x) value Year (x-1) value] / Year (x-1) value.
For example, if Total revenue for 2014 is 5,000 and Total revenue for 2013 is 4,000, the annual growth rate from 2013 to 2014 would be calculated as: [5000 4000] / 4000 = .25. This translates to 25.0% growth.
|
| 2014-2015 | 2011-2012 |
| Net income |
|
|
| Net cash provided by operating activities |
|
|
| EPS (diluted) |
|
|
| Franchise royalties and fees |
|
|
EXHIBITI Selected Consolidated Financial Data for Panera Bread, 2011-2015 (in thousands, except for per-share amounts) 2015 2014 2013 2012 2011 Income Statement Data $2,358,794 $2,230,370 $2,108,908 $1,879,280 $1,592,951 138,563 123,686 112,641 102,076 92,793 175,139 184.223 2,681,580 163,453 2,529,195 2,385,002 148,701 2,130,057 136,288 1.822.032 715,502 754.646 169,998 334,635 1,974,781 669,860 685,576 159,794 314,879 1,830,109 625,622 625,457 148,816 295,539 1,695,434 552,580 559,446 130,793 256,029 1,498,848 470,398 484,014 115,290 216,237 1.285,939 Revenues: Bakery-caf sales Franchise royalties and fees Fresh dough and other product sales to franchisees Total revenues Bakery-caf expenses: Food and paper products Labor Occupancy Other operating expenses Total bakery-caf expenses Fresh dough and other product cost of sales to franchisees Depreciation and amortization General and administrative expenses Pre-opening expenses Total costs and expenses Operating profit Interest expense Other (income) expense, net Income taxes Less net income (loss) attributable to non-controlling interest Net income to shareholders Earnings per share Basic 160,706 152,267 142,160 131.006 135.398 124,109 106,523 90.939 142,904 138,060 123,335 117,932 9,089 8,707 7,794 8,462 2,439,986 2,253,252 2,075,246 1,847,187 241.594 275,943 309,756 282,870 3,830 1,824 1,053 1,082 1,192 (3,175) (4,017) (1,208) 87,247 98,001 116,551 109,548 116,267 79,899 113.083 6,585 1.601.773 220,259 822 (466) 83,951 (17) $ 149,325 $ 179,293 196,169 $ 173,448 $ 135,952 $5.81 $6.67 $6.85 $5.94 $4.59 5.79 6.64 6.81 5.89 4.55 Diluted Weighted average shares outstanding Basic Diluted 25,685 25.788 26,881 26,999 28,629 28,794 29,217 29,455 29,601 29.903 Balance Sheet Data Cash and cash equivalents Current assets Total assets Current liabilities Total liabilities Stockholders' equity $ 241,886 $ 196,493 $ 125,245 $ 297,141 $ 222,640 502,789 406,166 302,716 478,842 353,119 1,475,318 1,390,686 1,180,862 1,268,163 1,027,322 399,443 352,712 303,325 277,540 238,334 974,037 654,502 480,970 446,244 372,246 497,300 736,184 699,892 821,919 655,076 Cash Flow Data Net cash provided by operating activities $ 318,045 $ 335,079 $ 348,417 $ 289,456 $ 236,889 Net cash used in investing activities (165,415) (211,317) (188,307) (195.741) (152.194) Net cash (used in) provided by financing activities (107,237) (52,514) (332,006) (19,214) (91,354) Net (decrease) increase in cash and cash equivalents 45,393 71,248 (171,896) 74,501 16,659) Sources: 2015 10-K report, pp. 43-46; 2014 10-K report, pp. 41-43: 2013 10-K report, pp. 41-43, 2011 10-K report, pp. 41-43
Step by Step Solution
There are 3 Steps involved in it

Get step-by-step solutions from verified subject matter experts