

Question: Calculate the following with mathematical formulas using the tables' data of Air Canada company.( The tables are balance sheet and income statement.) *Efficiency Ratios (Inventory
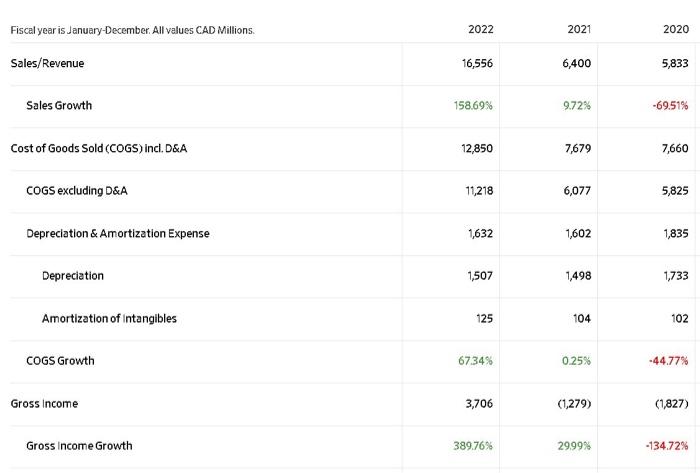
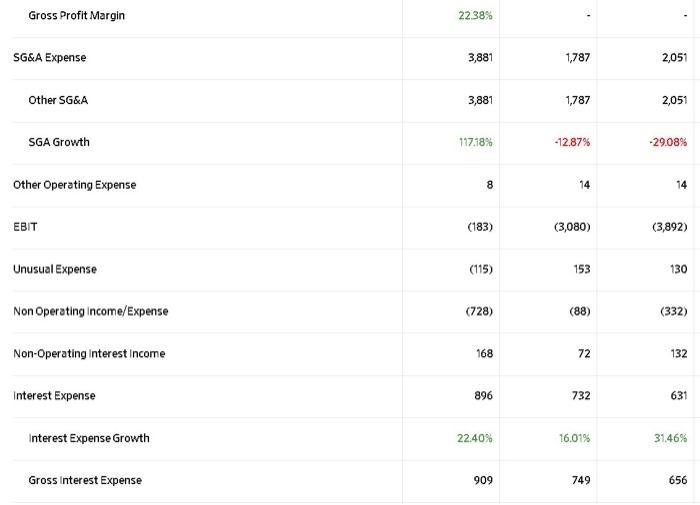
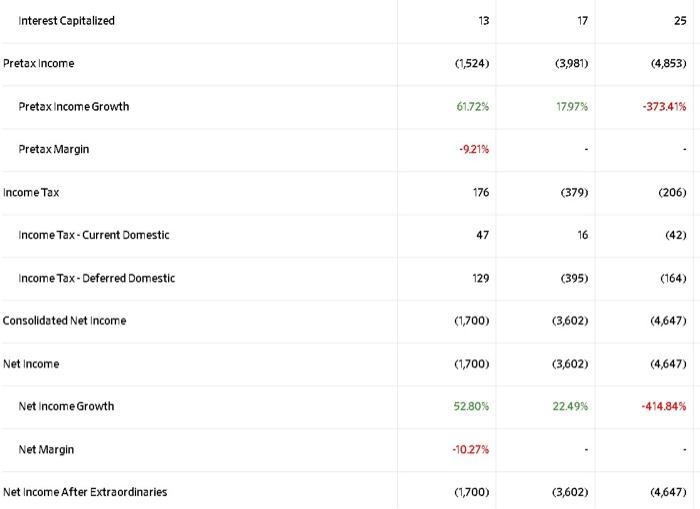
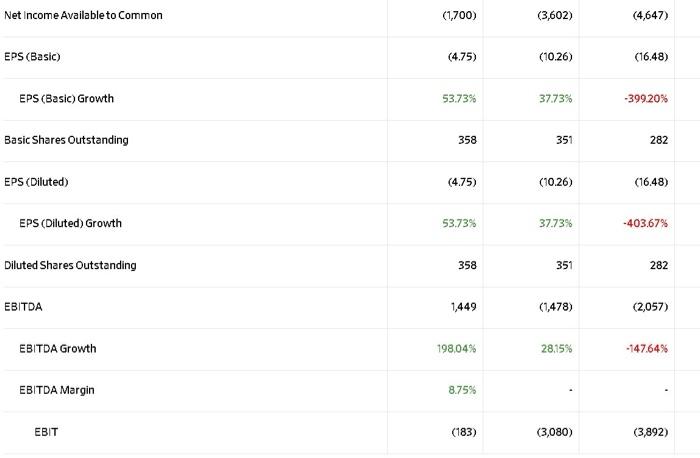
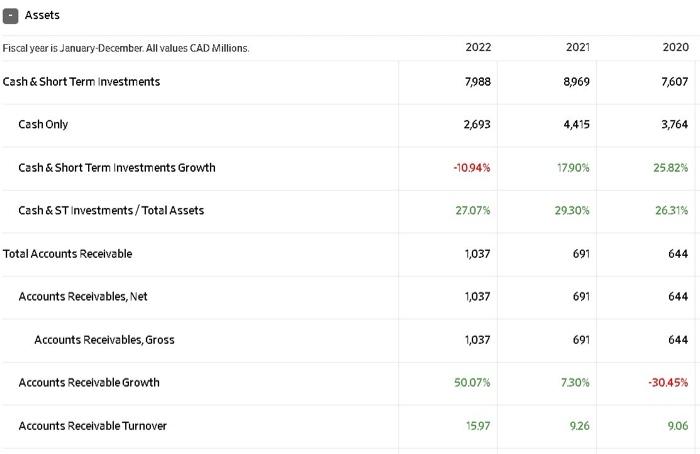
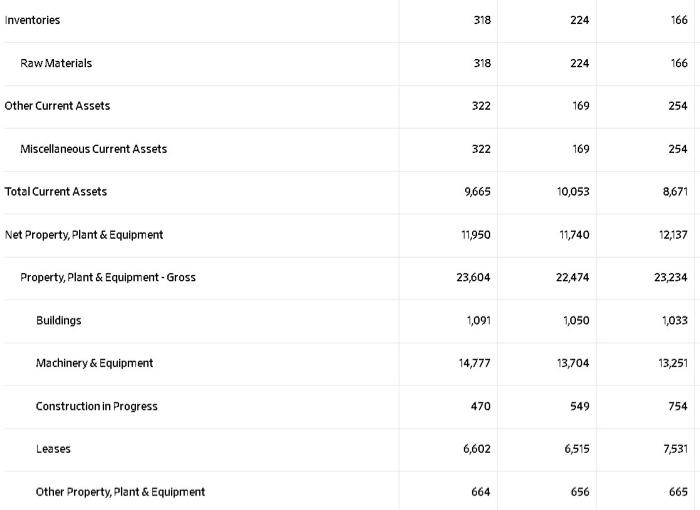
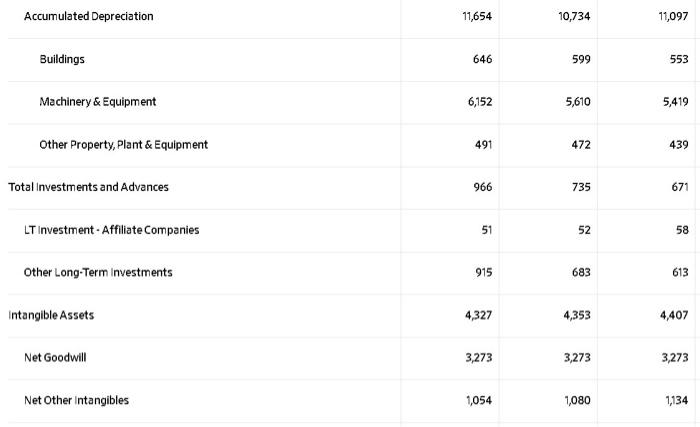
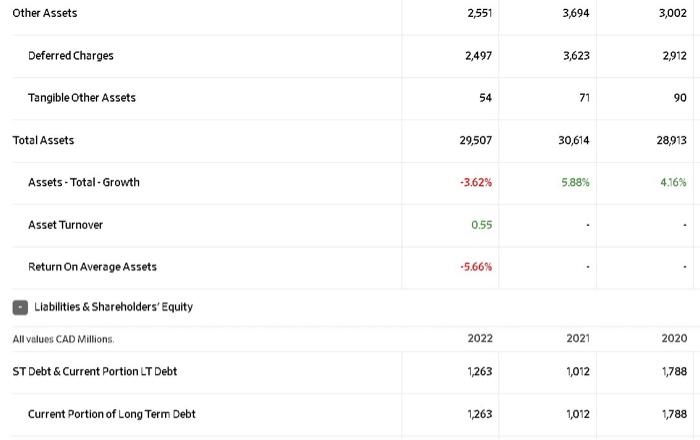
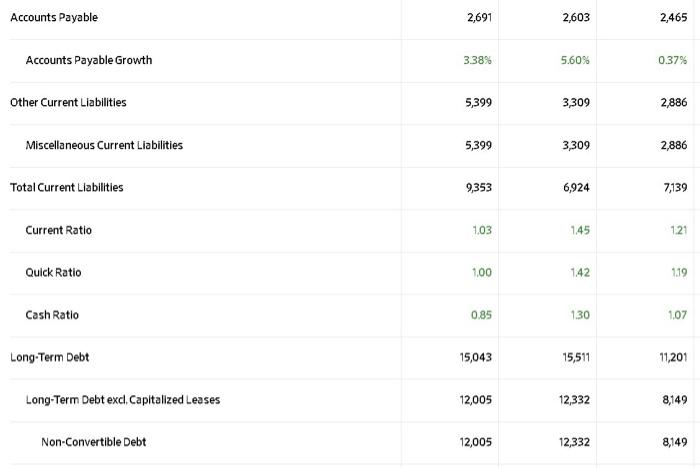
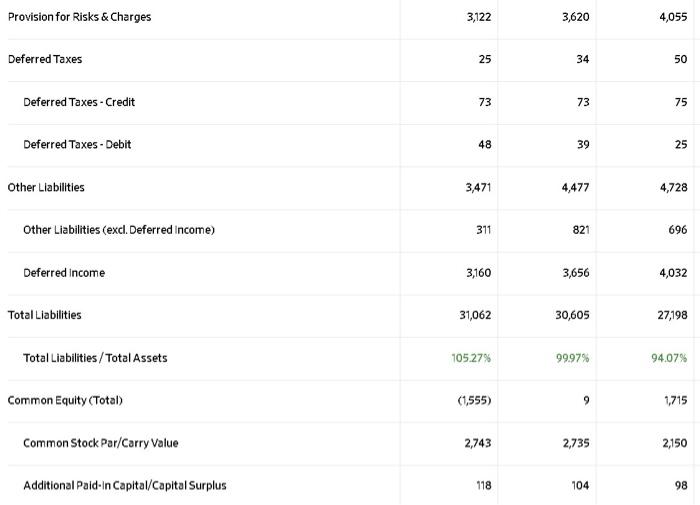
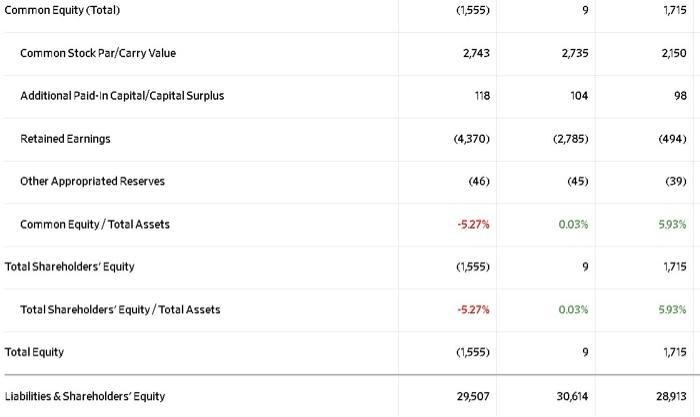
\begin{tabular}{|c|c|c|c|} \hline Gross Profit Margin & 22.38% & - & - \\ \hline SG\&A Expense & 3,881 & 1,787 & 2,051 \\ \hline Other SG\&A & 3,881 & 1,787 & 2,051 \\ \hline SGA Growth & 117.18% & 12.87% & 29.08% \\ \hline Other Operating Expense & 8 & 14 & 14 \\ \hline EBIT & (183) & (3,080) & (3,892) \\ \hline Unusual Expense & (115) & 153 & 130 \\ \hline Non Operating income/Expense & (728) & (88) & (332) \\ \hline Non-Operating Interest Income & 168 & 72 & 132 \\ \hline Interest Expense & 896 & 732 & 631 \\ \hline Interest Expense Growth & 22.40% & 16.01% & 31.46% \\ \hline Gross Interest Expense & 909 & 749 & 656 \\ \hline \end{tabular} \begin{tabular}{|c|c|c|c|} \hline Interest Capitalized & 13 & 17 & 25 \\ \hline Pretax Income & (1,524) & (3,981) & (4,853) \\ \hline Pretaxincome Growth & 61.72% & 17.97% & 373.41% \\ \hline PretaxMargin & .9.21% & - & . \\ \hline Income Tax & 176 & (379) & (206) \\ \hline Income Tax-Current Domestic & 47 & 16 & (42) \\ \hline Income Tax-Deferred Domestic & 129 & (395) & (164) \\ \hline Consolidated Net Income & (1,700) & (3,602) & (4,647) \\ \hline Net income & (1,700) & (3,602) & (4,647) \\ \hline Net Income Growth & 52.80% & 22.49% & 414.84% \\ \hline Net Margin & 10.27% & - & . \\ \hline Net Income After Extraordinaries & (1,700) & (3,602) & (4,647) \\ \hline \end{tabular} \begin{tabular}{|c|c|c|c|} \hline Net Income Available to Common & (1,700) & (3,602) & (4,647) \\ \hline EPS (Basic) & (4.75) & (10.26) & (16.48) \\ \hline EPS (Basic) Growth & 53.73% & 37.73% & 399.20% \\ \hline Basic Shares Outstanding & 358 & 351 & 282 \\ \hline EPS (Diluted) & (4.75) & (10.26) & (16.48) \\ \hline EPS (Diluted) Growth & 53.73% & 37.73% & 403.67% \\ \hline Diluted Shares Outstanding & 358 & 351 & 282 \\ \hline EBITDA & 1,449 & (1,478) & (2,057) \\ \hline EBITDA Growth & 198.04% & 28.15% & 147.64% \\ \hline EBITDA Margin & 8.75% & . & - \\ \hline EBIT & (183) & (3,080) & (3,892) \\ \hline \end{tabular} Assets \begin{tabular}{|c|c|c|c|} \hline Fiscal year is January-December. All values CAD Mi & 2022 & 2021 & 2020 \\ \hline Cash \& Short Term Investments & 7,988 & 8,969 & 7,607 \\ \hline Cash Only & 2,693 & 4,415 & 3,764 \\ \hline Cash \& Short Term Investments Growth & 10.94% & 17.90% & 25.82% \\ \hline Cash \& ST investments / Total Assets & 27.07% & 2930% & 2631% \\ \hline Total Accounts Receivable & 1,037 & 691 & 644 \\ \hline Accounts Recelvables, Net & 1,037 & 691 & 644 \\ \hline Accounts Receivables, Gross & 1,037 & 691 & 644 \\ \hline Accounts Receivable Growth & 50.07% & 7.30% & 30.45% \\ \hline Accounts Receivable Turnover & 15.97 & 9.26 & 9.06 \\ \hline \end{tabular} \begin{tabular}{|c|c|c|c|} \hline Inventories & 318 & 224 & 166 \\ \hline Raw Materials & 318 & 224 & 166 \\ \hline Other Current Assets & 322 & 169 & 254 \\ \hline Miscellaneous Current Assets & 322 & 169 & 254 \\ \hline Total Current Assets & 9,665 & 10,053 & 8,671 \\ \hline Net Property, Plant \& Equipment & 11,950 & 11,740 & 12,137 \\ \hline Property, Plant \& Equipment - Gross & 23,604 & 22,474 & 23,234 \\ \hline Buildings & 1,091 & 1,050 & 1,033 \\ \hline Machinery \& Equipment & 14,777 & 13,704 & 13,251 \\ \hline Construction in Progress & 470 & 549 & 754 \\ \hline Leases & 6,602 & 6,515 & 7,531 \\ \hline Other Property, Plant \& Equipment & 664 & 656 & 665 \\ \hline \end{tabular} \begin{tabular}{|c|c|c|c|} \hline Accumulated Depreciation & 11,654 & 10,734 & 11,097 \\ \hline Buildings & 646 & 599 & 553 \\ \hline Machinery \& Equipment & 6,152 & 5,610 & 5,419 \\ \hline Other Property, Plant \& Equipment & 491 & 472 & 439 \\ \hline Total Investments and Advances & 966 & 735 & 671 \\ \hline LT Investment - Affiliate Companies & 51 & 52 & 58 \\ \hline Other Long-Term Investments & 915 & 683 & 613 \\ \hline Intangible Assets & 4,327 & 4,353 & 4,407 \\ \hline Net Goodwill & 3,273 & 3,273 & 3,273 \\ \hline Net Other Intangibles & 1,054 & 1,080 & 1,134 \\ \hline \end{tabular} \begin{tabular}{|c|c|c|c|} \hline Other Assets & 2,551 & 3,694 & 3,002 \\ \hline Deferred Charges & 2,497 & 3,623 & 2,912 \\ \hline Tangible Other Assets & 54 & 71 & 90 \\ \hline Total Assets & 29,507 & 30,614 & 28,913 \\ \hline Assets - Total-Growth & 3.62% & 5.88% & 4.16% \\ \hline Asset Turnover & 0.55 & & . \\ \hline Return On Average Assets & 5.66% & & . \\ \hline \multicolumn{4}{|l|}{ - Liabilities \& Shareholders' Equity } \\ \hline All values CAD Millions: & 2022 & 2021 & 2020 \\ \hline ST Debt \& Current Portion LT Debt & 1,263 & 1,012 & 1,788 \\ \hline Current Portion of Long Term Debt & 1,263 & 1,012 & 1,788 \\ \hline \end{tabular} \begin{tabular}{|c|c|c|c|} \hline Accounts Payable & 2,691 & 2,603 & 2,465 \\ \hline Accounts Payable Growth & 3.38% & 5.60% & 0.37% \\ \hline Other Current Liabilities & 5,399 & 3,309 & 2,886 \\ \hline Miscellaneous Current Liabilities & 5,399 & 3,309 & 2,886 \\ \hline Total Current Liabilities & 9,353 & 6,924 & 7,139 \\ \hline Current Ratio & 1.03 & 1.45 & 1.21 \\ \hline Quick Ratio & 1.00 & 1.42 & 1,19 \\ \hline Cash Ratio & 0.85 & 1.30 & 1.07 \\ \hline Long-Term Debt & 15,043 & 15,511 & 11,201 \\ \hline Long-Term Debt excl. Capitalized Leases & 12,005 & 12,332 & 8,149 \\ \hline Non-Convertible Debt & 12,005 & 12,332 & 8,149 \\ \hline \end{tabular} \begin{tabular}{|c|c|c|c|} \hline Provision for Risks \& Charges & 3,122 & 3,620 & 4,055 \\ \hline Deferred Taxes & 25 & 34 & 50 \\ \hline Deferred Taxes - Credit & 73 & 73 & 75 \\ \hline Deferred Taxes - Debit & 48 & 39 & 25 \\ \hline Other Liabilities & 3,471 & 4,477 & 4,728 \\ \hline Other Liabilities (excl. Deferred Income) & 311 & 821 & 696 \\ \hline Deferred income & 3,160 & 3,656 & 4,032 \\ \hline Total Liabilities & 31,062 & 30,605 & 27,198 \\ \hline Total Liabilities / Total Assets & 105.27% & 9997% & 94.07% \\ \hline Common Equity (Total) & (1,555) & 9 & 1,715 \\ \hline Common Stock Par/Carry Value & 2,743 & 2,735 & 2,150 \\ \hline Additional PaidIn Capital/Capital Surplus & 118 & 104 & 98 \\ \hline \end{tabular} \begin{tabular}{|c|c|c|c|} \hline Common Equity (Total) & (1,555) & 9 & 1,715 \\ \hline Common Stock Par/Carry Value & 2,743 & 2,735 & 2,150 \\ \hline Additional Paid-In Capital/Capital Surplus & 118 & 104 & 98 \\ \hline Retained Earnings & (4,370) & (2,785) & (494) \\ \hline Other Appropriated Reserves & (46) & (45) & (39) \\ \hline Common Equity / Total Assets & 5.27% & 0.03% & 5.93% \\ \hline Total Shareholders' Equity & (1,555) & 9 & 1,715 \\ \hline Total Shareholders' Equity/ Total Assets & .5.27% & 0.03% & 5.93% \\ \hline Total Equity & (1,555) & 9 & 1,715 \\ \hline Liabilities \& Shareholders' Equity & 29,507 & 30,614 & 28,913 \\ \hline \end{tabular}
Step by Step Solution
There are 3 Steps involved in it

Get step-by-step solutions from verified subject matter experts