

Question: Calculate the following with mathematical formulas using the tables' data of Air Canada company.( The tables are balance sheet and income statement.) *Efficiency Ratios (Inventory
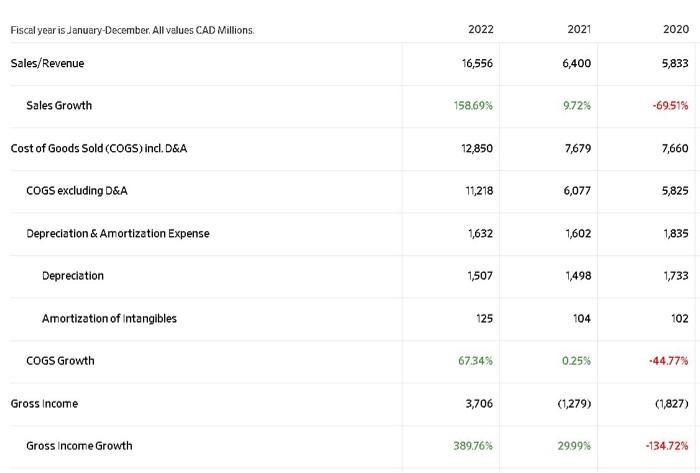
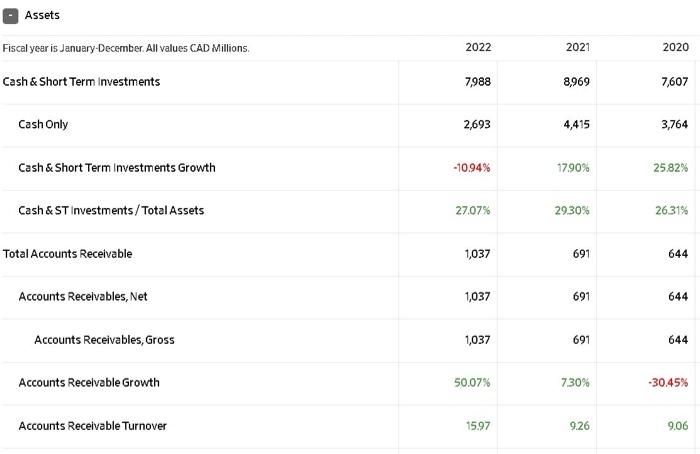
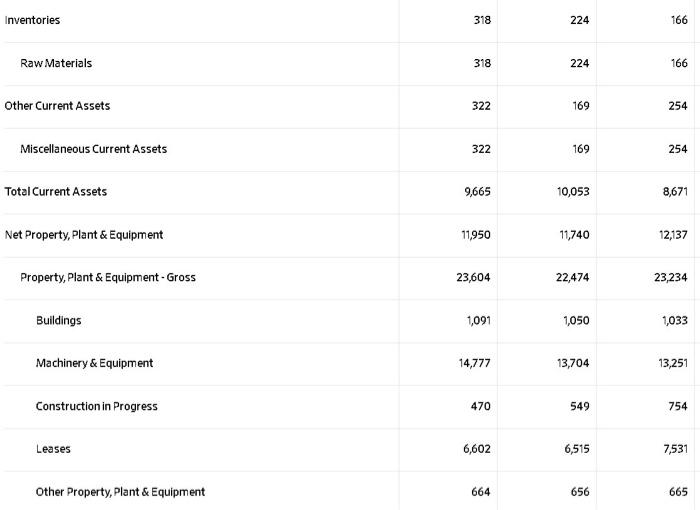
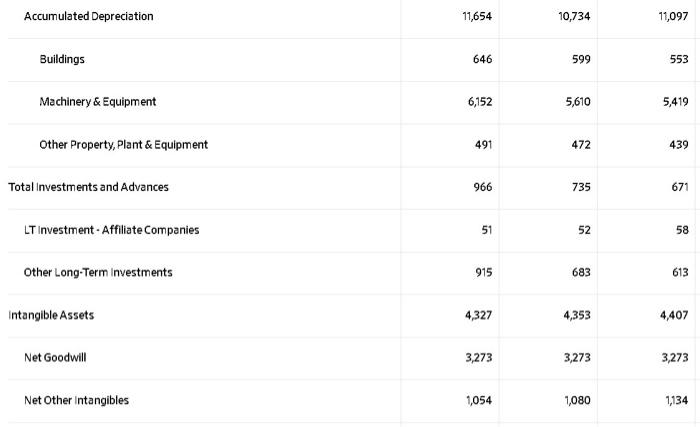
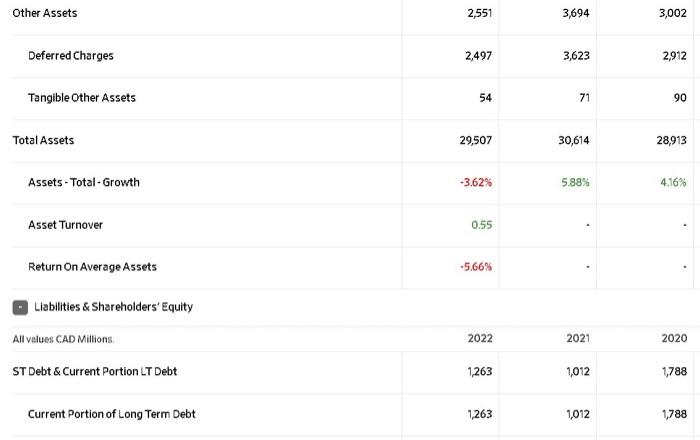
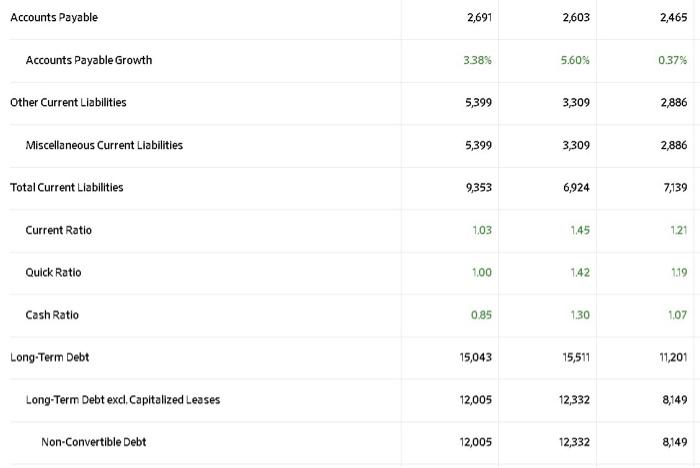
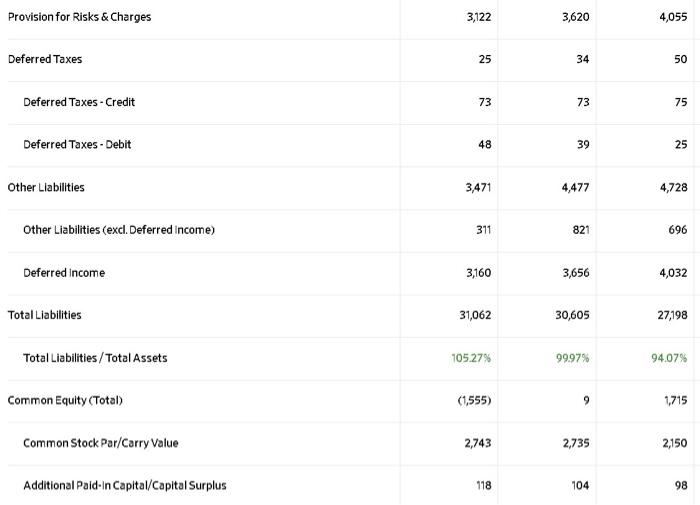
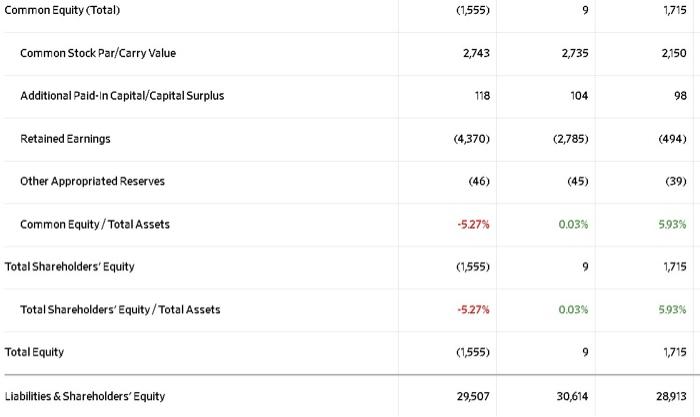
Fiscal year is January-December. All values CAD Millions. Sales/Revenue Sales Growth Cost of Goods Sold (COGS) incl. D&A COGS excluding D&A Depreciation & Amortization Expense Depreciation Amortization of intangibles COGS Growth Gross income Gross Income Growth 2022 16,556 158.69% 12,850 11,218 1,632 1,507 125 67.34% 3,706 389.76% 2021 6,400 9.72% 7,679 6,077 1,602 1,498 104 0.25% (1,279) 29.99% 2020 5,833 -69.51% 7,660 5,825 1,835 1,733 102 -44.77% (1,827) -134.72%
Step by Step Solution
3.37 Rating (150 Votes )
There are 3 Steps involved in it
Here are the calculations for the efficiency ratios Inventory Turnover Ratio 2022 ... View full answer

Get step-by-step solutions from verified subject matter experts