

Question: Calculate the linear correlation coefficient by completing the following table, round all values in the table to 2 decimals. Make all calculations using 2 decimals.
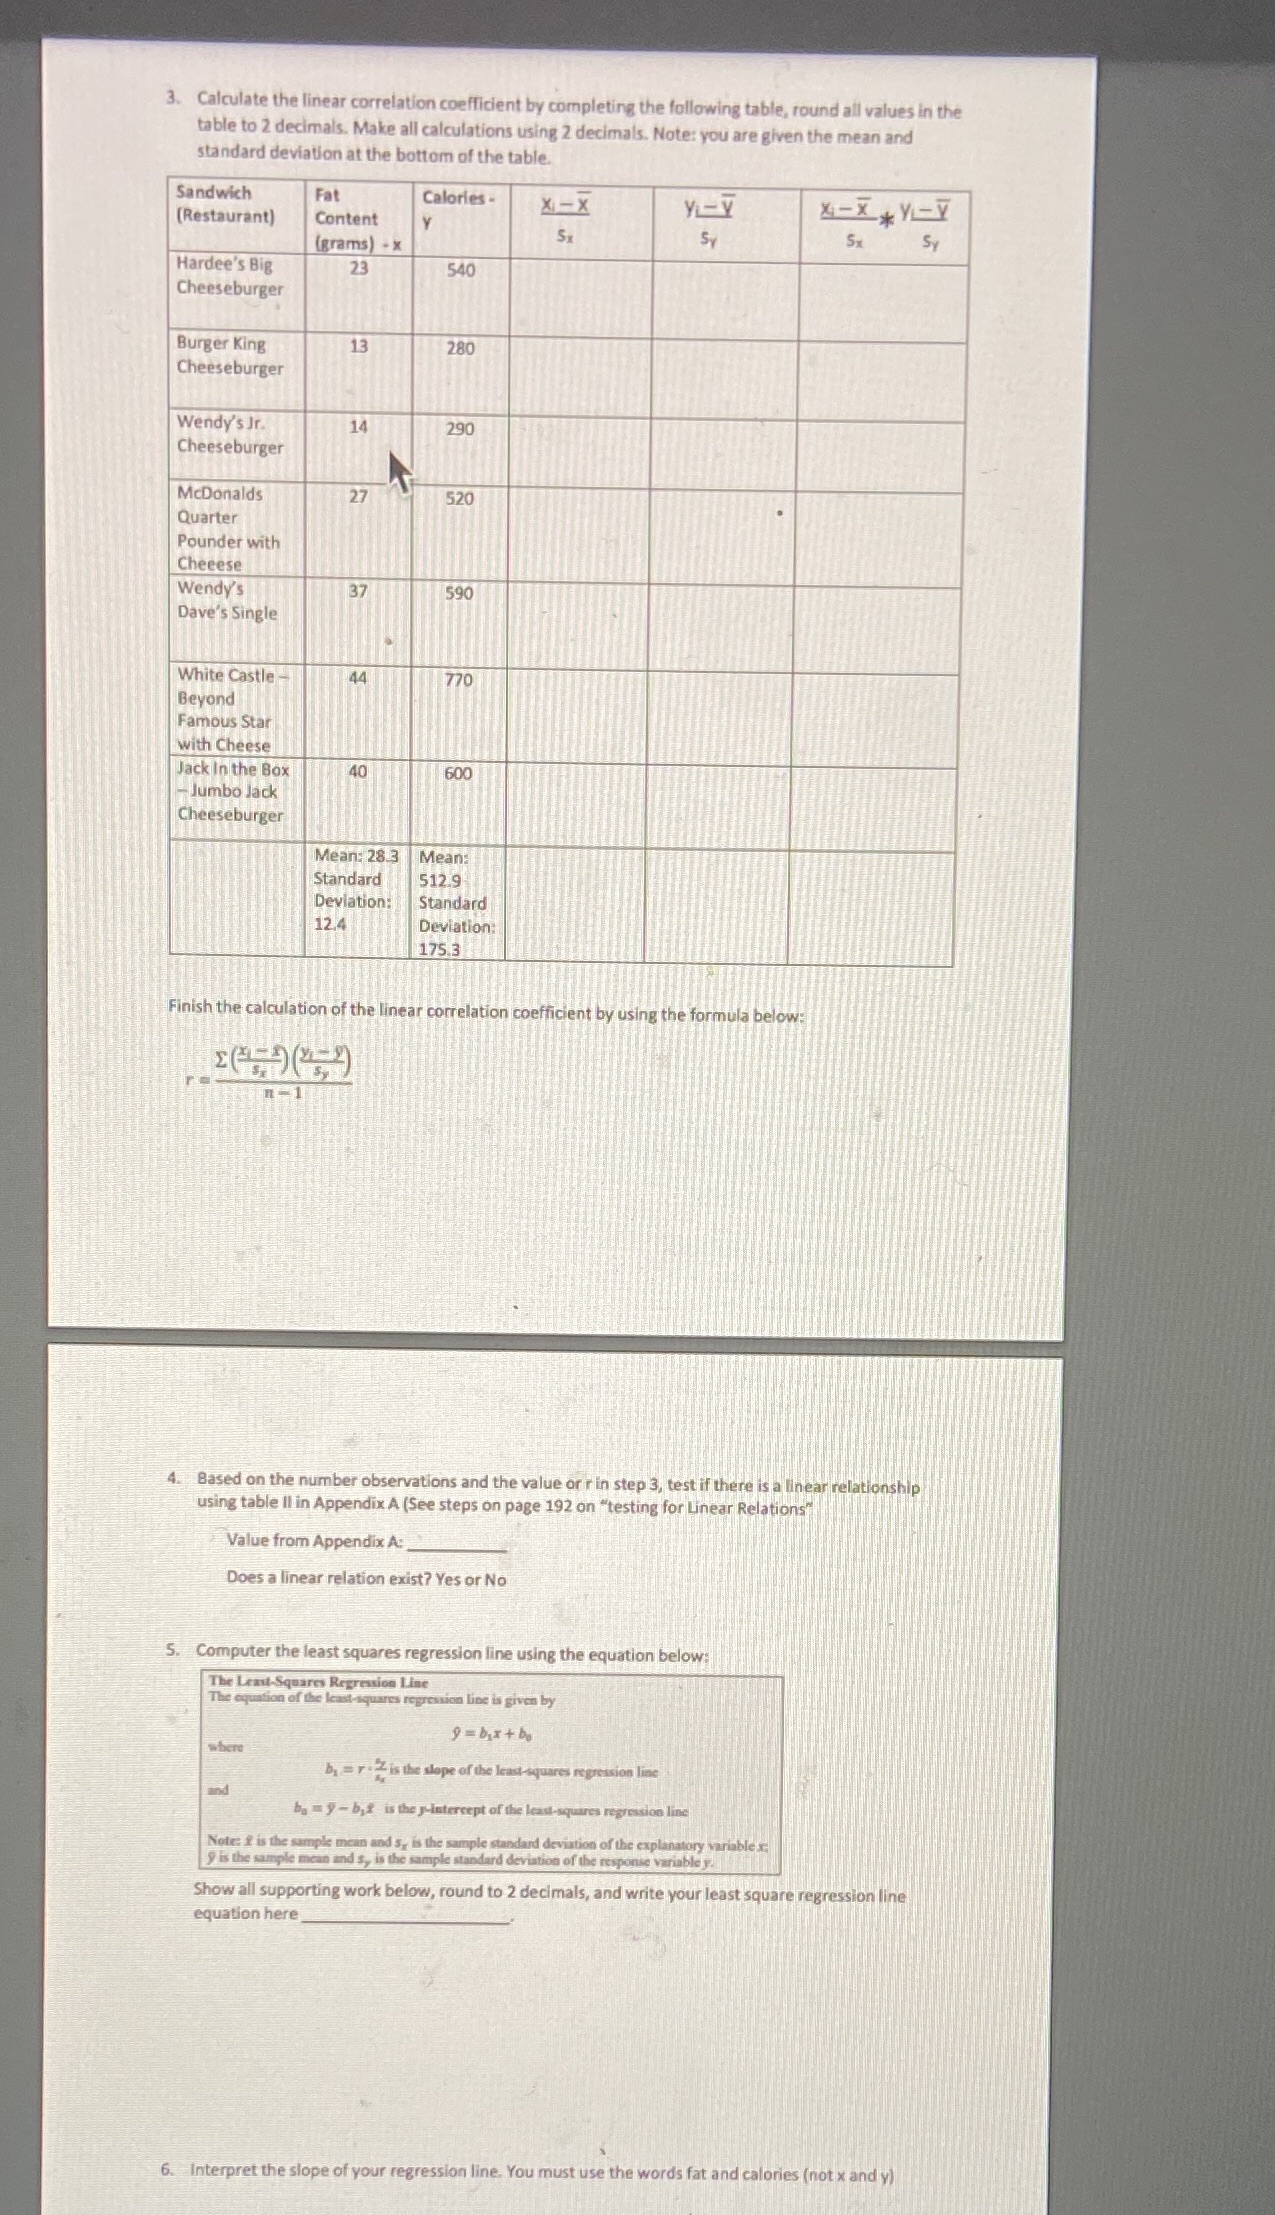
Calculate the linear correlation coefficient by completing the following table, round all values in the table to 2 decimals. Make all calculations using 2 decimals. Note: you are given the mean and standard deviation at the bottom of the table. Sandwich Fat Calories - X-X YL-Y X-X * YL-Y (Restaurant) Content SX SY Sy (grams) - x Hardee's Big 23 540 Cheeseburger Burger King 13 280 Cheeseburger Wendy's Jr. 14 290 Cheeseburger Mcdonalds 27 520 Quarter Pounder with Cheeese Wendy's 37 590 Dave's Single White Castle 44 770 Beyond Famous Star with Cheese Jack In the Box 40 600 -Jumbo Jack Cheeseburger Mean: 28.3 Mean: Standard 512.9 Deviation: Standard 12.4 Deviation: 175.3 Finish the calculation of the linear correlation coefficient by using the formula below: n-1 Based on the number observations and the value or r in step 3, test if there is a linear relationship using table II in Appendix A (See steps on page 192 on "testing for Linear Relations" Value from Appendix A: Does a linear relation exist? Yes or No 5. Computer the least squares regression line using the equation below: The Least-Squares Regression Line The equation of the least-squares regression line is given by where by mroz is the slope of the least-squares regression ling ba my - b, f is the y-intercept of the least Note: f is the sample mean and s, is the san ation of the explanatory variable . " is the sample mean and sy is the sample st lard deviation of the response variable Show all supporting work below, round to 2 decimals, and write your least square regression line equation here 6. Interpret the slope of your regression line. You must use the words fat and calories (not x and y)
Step by Step Solution
There are 3 Steps involved in it

Get step-by-step solutions from verified subject matter experts