

Question: Calculate the missing ratios for TTM: Consider the below financial and market data: Articulated Device Inventors Ratio Analysis for Q1 Ending: 3/31/20Xi ADI TTM Balance
Calculate the missing ratios for TTM:
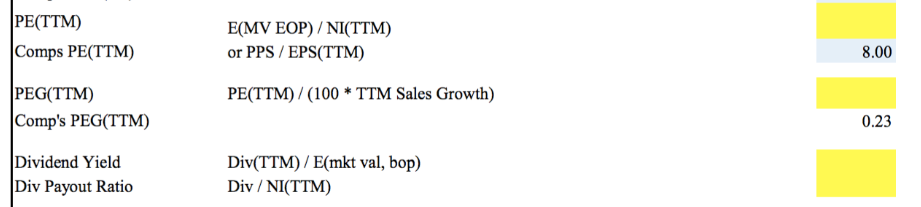
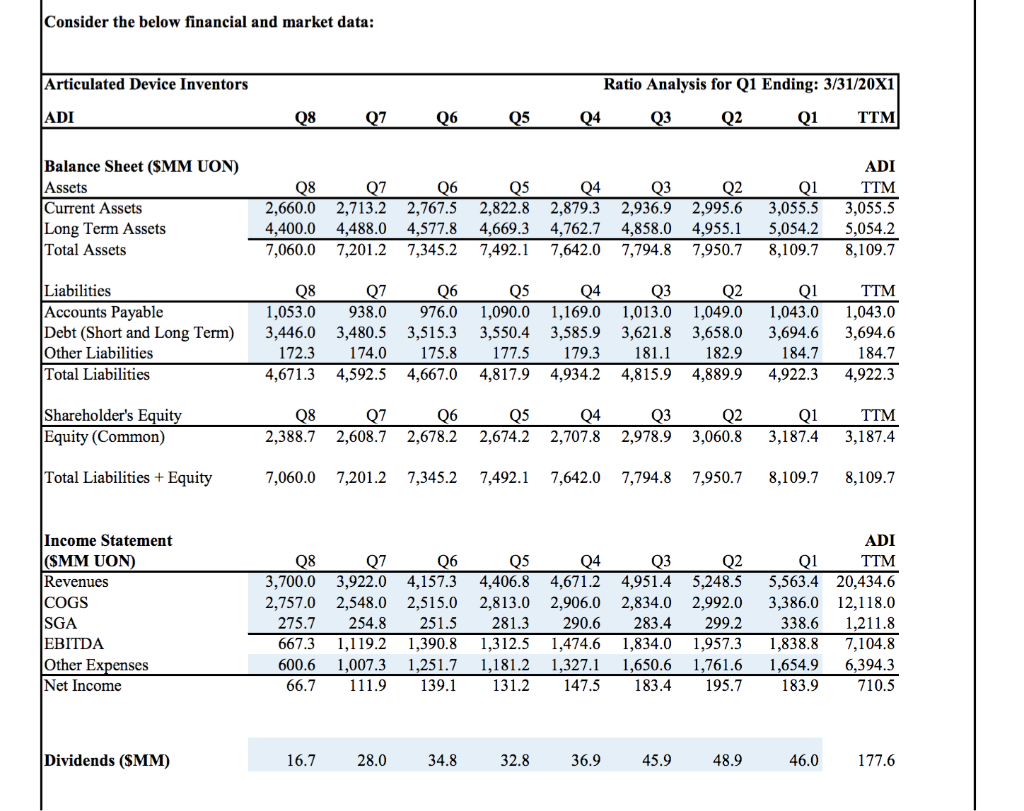
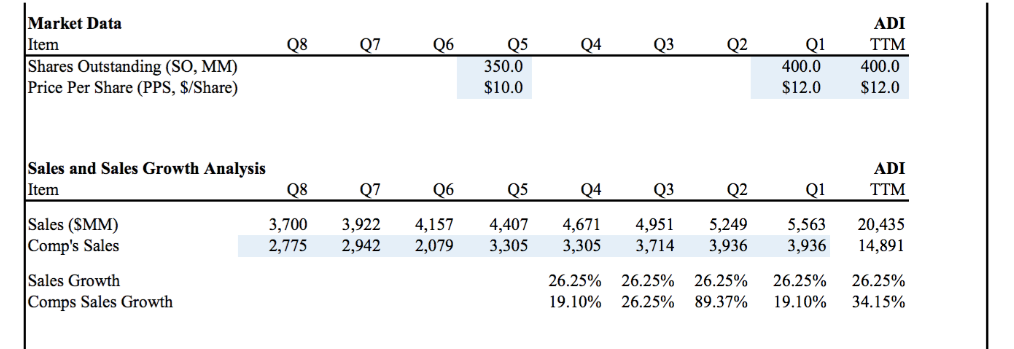
Consider the below financial and market data: Articulated Device Inventors Ratio Analysis for Q1 Ending: 3/31/20Xi ADI TTM Balance Sheet (SMM UON) Assets Current Assets Long Term Assets Total Assets ADI 2,660.0 2,713.2 2,767.5 2,822.8 2,879.3 2,936.9 2,995.6 3,055.53,055.5 4,400.0 4,488.0 4,577.8 4,669.3 4,762.7 4,858.0 4,955.15,054.25,054.2 7,060.0 7,201.2 7,345.2 7,492.1 7,642.0 7,794.87,950.78,109.78,109.7 Liabilities Accounts Payable Debt (Short and Long Term) 3,446.0 3,480.5 3,515.3 3,550.4 3,585.9 3,621.8 3,658.0 3,694.63,694.6 Other Liabilities Total Liabilities 1,053.0938.0 976.0 1,090.0 1,169.0 1,013.01,049.01,043.01,043.0 184.7 4,671.3 4,592.5 4,667.0 4,817.9 4,934.2 4,815.9 4,889.9 4,922.34,922.3 172.3 174.0175.8 177.5 179.3 1811 182.9 184.7 Shareholder's Equity (Common) Q2 2,388.7 2,608.72,678.2 2,674.2 2,707.8 2,978.9 3,060.8 3,187.43,187.4 Total Liabilities + Equity 7,060.0 7,201.2 7,345.2 7,492.1 7,642.0 7,794.8 7,950.7 8,109.78,109.7 Income Statement (SMM UON) Revenues COGS SGA EBITDA Other Expenses Net Income ADI Q1TTM 3,700.03,922.0 4,157.3 4,406.8 4,671.2 4,951.4 5,248.55,563.420,434.6 2,757.0 2,548.0 2,515.0 2,813.0 2,906.0 2,834.0 2,992.0 3,386.0 12,118.0 275.7 254.8 251.5 281.3 290.6 283.4 299.2 338.6211.8 667.3 1,119.2 1,390.8 1,312.51,474.6 1,834.0 1,957.31,838.8 7,104.8 600.6 1,007.31,251.71,181.2 1,327.1 1,650.61,761.6 1,654.96,394.3 183.9 710.5 Q4 Q2 66.7 111.9 139.1 131.2 147.5 183.4195.7 Dividends (SMM) 16.7 28.0 34.8 32.8 36.9 45.9 48.9 46.0 Market Data Item Shares Outstanding (SO, MM) Price Per Share (PPS, $/Share) ADI TTM 400.0 $12.0 $12.0 01 400.0 Q4 350.0 $10.0 Sales and Sales Growth Analysis Item Sales (SMM) Comp's Sales Sales Growth Comps Sales Growth ADI TTM 3,7003,9224,1574,407 4,6714,9515,2495,563 20,435 2,775 2,9422,079 3,305 3,305 3,7143,936 3,936 14,891 26.25% 26.25% 26.25% 26.25% 26.25% 19.10% 26.25% 89.37% 19.10% 34.15% Q4 Q1 PE(TTM) Comps PE(TTM) PEG(TTM) Comps PEG(TTM) Dividend Yield Div Payout Ratio E(MV EOP) / NI(TTM) or PPS / EPS(TTM) 8.00 PE(TTM) (100 TTM Sales Growth) 0.23 Div TTM) /E(mkt val, bop) Div /NI(TTM) Consider the below financial and market data: Articulated Device Inventors Ratio Analysis for Q1 Ending: 3/31/20Xi ADI TTM Balance Sheet (SMM UON) Assets Current Assets Long Term Assets Total Assets ADI 2,660.0 2,713.2 2,767.5 2,822.8 2,879.3 2,936.9 2,995.6 3,055.53,055.5 4,400.0 4,488.0 4,577.8 4,669.3 4,762.7 4,858.0 4,955.15,054.25,054.2 7,060.0 7,201.2 7,345.2 7,492.1 7,642.0 7,794.87,950.78,109.78,109.7 Liabilities Accounts Payable Debt (Short and Long Term) 3,446.0 3,480.5 3,515.3 3,550.4 3,585.9 3,621.8 3,658.0 3,694.63,694.6 Other Liabilities Total Liabilities 1,053.0938.0 976.0 1,090.0 1,169.0 1,013.01,049.01,043.01,043.0 184.7 4,671.3 4,592.5 4,667.0 4,817.9 4,934.2 4,815.9 4,889.9 4,922.34,922.3 172.3 174.0175.8 177.5 179.3 1811 182.9 184.7 Shareholder's Equity (Common) Q2 2,388.7 2,608.72,678.2 2,674.2 2,707.8 2,978.9 3,060.8 3,187.43,187.4 Total Liabilities + Equity 7,060.0 7,201.2 7,345.2 7,492.1 7,642.0 7,794.8 7,950.7 8,109.78,109.7 Income Statement (SMM UON) Revenues COGS SGA EBITDA Other Expenses Net Income ADI Q1TTM 3,700.03,922.0 4,157.3 4,406.8 4,671.2 4,951.4 5,248.55,563.420,434.6 2,757.0 2,548.0 2,515.0 2,813.0 2,906.0 2,834.0 2,992.0 3,386.0 12,118.0 275.7 254.8 251.5 281.3 290.6 283.4 299.2 338.6211.8 667.3 1,119.2 1,390.8 1,312.51,474.6 1,834.0 1,957.31,838.8 7,104.8 600.6 1,007.31,251.71,181.2 1,327.1 1,650.61,761.6 1,654.96,394.3 183.9 710.5 Q4 Q2 66.7 111.9 139.1 131.2 147.5 183.4195.7 Dividends (SMM) 16.7 28.0 34.8 32.8 36.9 45.9 48.9 46.0 Market Data Item Shares Outstanding (SO, MM) Price Per Share (PPS, $/Share) ADI TTM 400.0 $12.0 $12.0 01 400.0 Q4 350.0 $10.0 Sales and Sales Growth Analysis Item Sales (SMM) Comp's Sales Sales Growth Comps Sales Growth ADI TTM 3,7003,9224,1574,407 4,6714,9515,2495,563 20,435 2,775 2,9422,079 3,305 3,305 3,7143,936 3,936 14,891 26.25% 26.25% 26.25% 26.25% 26.25% 19.10% 26.25% 89.37% 19.10% 34.15% Q4 Q1 PE(TTM) Comps PE(TTM) PEG(TTM) Comps PEG(TTM) Dividend Yield Div Payout Ratio E(MV EOP) / NI(TTM) or PPS / EPS(TTM) 8.00 PE(TTM) (100 TTM Sales Growth) 0.23 Div TTM) /E(mkt val, bop) Div /NI(TTM)
Step by Step Solution
There are 3 Steps involved in it

Get step-by-step solutions from verified subject matter experts