Question: calculate the Profit Margin, Return on Assets and Return on Equity ratios for 2016 show all working Nike, Inc. Income Statement Annual Income Statement (values
calculate the Profit Margin, Return on Assets and Return on Equity ratios for 2016 show all working
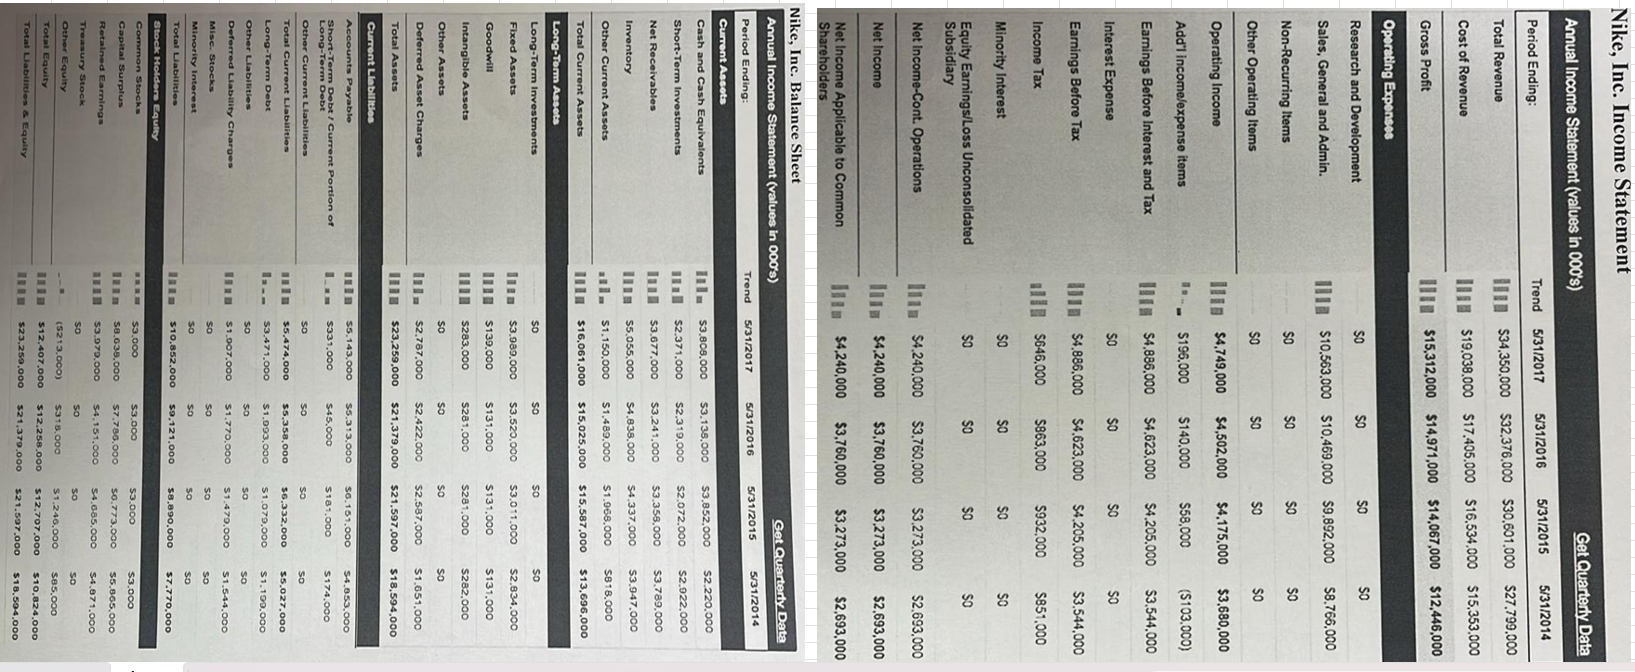
Nike, Inc. Income Statement Annual Income Statement (values in 000's) Get Quarterly Data Trend 5/31/2017 5/31/2016 5/31/2015 5/31/2014 Period Ending: Total Revenue I $34,350.000 $32,376,000 $30,601.000 $27.799.000 Cost of Revenue $19.038,000 $17.405.000 $16.534.000 $15,353,000 Gross Profit $15,312,000 $14,971,000 $14.067,000 $12,446,000 Operating Expenses Research and Development Sales, General and Admin. 11 $10.563.000 $10.469.000 $9.892.000 58.766.000 Non-Recurring Items Other Operating Items Operating Income 1 $4,749,000 $4,502,000 $4.175,000 $3.680,000 Add'l income/expense items - - $196,000 $140,000 $58,000 ($103,000) Earnings Before Interest and Tax I $4.886.000 $4.623.000 $4.205.000 $3.544.000 Interest Expense Earnings Before Tax 11 $4.886.000 $4.623.000 $4,205.000 $3.544.000 Income Tax #1 $646,000 $863.000 5932,000 $851.000 Minority Interest Equity Earnings/Loss Unconsolidated Subsidiary Net Income-Cont. Operations I1 1 $4.240,000 $3.760.000 53.273.000 $2.693,000 Net Income IIIa $4,240,000 $3,760,000 $3.273.000 $2.693.000 Net Income Applicable to Common Im $4,240,000 $3,760,000 $3,273,000 $2,693,000 Shareholders Nike, Inc. Balance Sheet Annual Income Statement (values in 000's) Get Quarterly Data Period Ending: Trend 5/31/2017 5/31/2016 5/31/2015 5/31/2014 Current Assets Cash and Cash Equivalents III = $3.808,000 $3.138,000 $3.852,000 $2.220.000 Short-Term Investments $2.371,000 $2.319.000 $2.072.000 $2.922.000 Net Receivables I1 $3.677,000 $3.241.000 $3.358.000 $3.789.000 Inventory III $5.055.000 $4.838.000 $4.337.000 $3.947.000 Other Current Assets allm 51.150,000 $1.489.000 $1.968,000 $818,000 Total Current Assets III $16,061,000 $15,025,000 0 $15,587.000 $13,696.000 Long-Term Assets Long-Term Investments Fixed Assets III $3.989.000 $3.520.000 $3.011.000 $2.834.000 Goodwill III $139.000 $131.000 $131.000 $131.000 Intangible Assets III $283.000 $281.000 $281.000 $282.000 Other Assets SO SO SO SO Deferred Asset Charges 11 1 = $2.787.000 $2.422,000 $2.587.000 $1.651.000 Total Assets III $23,259,000 $21,379,000 $21,597.000 $18,594.000 Current Liabilities Accounts Payable IIIB $5.143.000 $5.313.000 $6.161.000 $4.053,000 Short-Term Debt / Current Portion of $331,000 545.000 Long-Term Debt $181.000 $174.000 Other Current Liabilities So SO SO So Total Current Liabilities III $5,474.000 $5,358,000 $6.332.000 $5.027.000 Long-Term Debt $3.471.000 $1.093.030 $1.079.000 $1.190.000 Other Liabilities So 50 SO SO Deferred Liability Charges III $1.007.000 51.770.000 $1.479,000 $1.544.000 Misc. Stocks SO SO Minority Interest so Total Liabilities IIIn $10.852,000 59.121,000 $8.890.000 $7.770.000 Stock Holders Equity Common Stocks .am 53.000 $3.000 $3.000 $3.000 Capital Surplus IRIn 58.635,000 $7.786,000 $6.773,000 $5.865.000 Retained Earnings 53.079.000 54.151,000 $4.085,000 $4.071.000 Treasury Stock SO SO So So Other Equity (5213.000) $318.000 $1.246,000 Total Equity $85.000 III $12.407.000 512,258.000 $12,707.000 $10,824.000 Total Liabilities & Equity HIIn $23,259.000 $21,379,000 $21.597.000 $18.594,000
Step by Step Solution
There are 3 Steps involved in it
1 Expert Approved Answer
Step: 1 Unlock
Question Has Been Solved by an Expert!
Get step-by-step solutions from verified subject matter experts
Step: 2 Unlock
Step: 3 Unlock
Students Have Also Explored These Related Finance Questions!