

Question: Calculate the ratios for 2015 & 2016 using the data below. Please show calculation by cell or numbers, thank you. D E G N P
Calculate the ratios for 2015 & 2016 using the data below.
Please show calculation by cell or numbers, thank you.
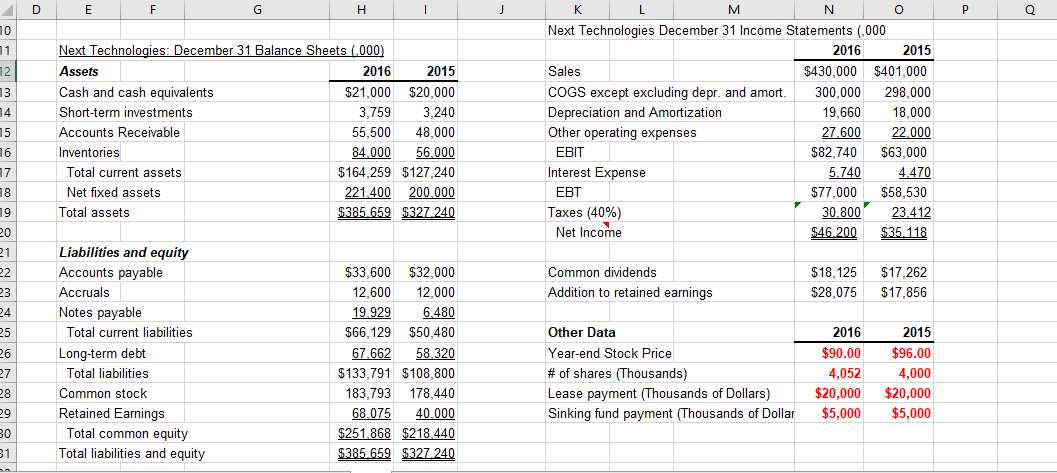
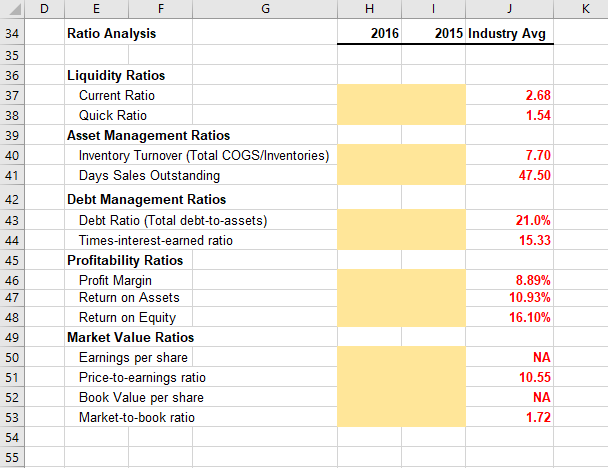
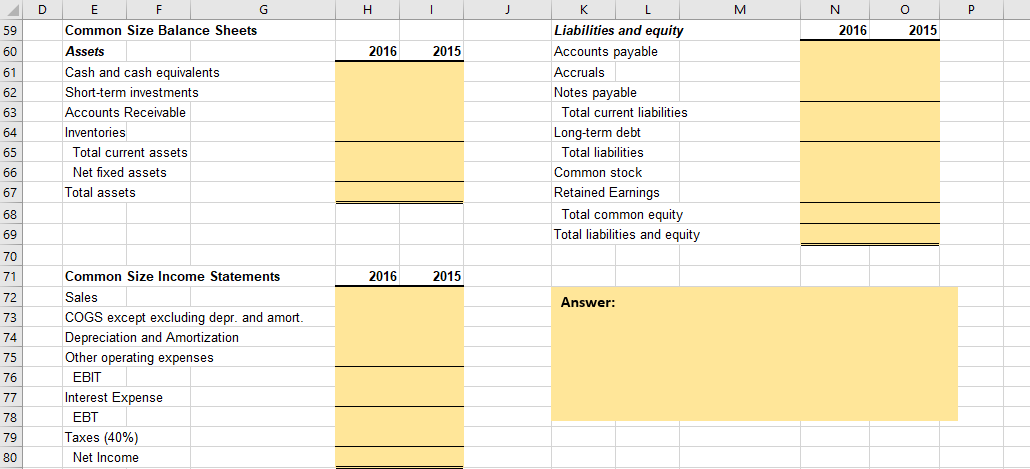
D E G N P Q 0 Next Technologies December 31 Income Statements (,000 Next Technologies: December 31 Balance Sheets (.000) 1 2016 2015 2 Assets 2016 2015 Sales $430,000 $401,000 COGS except excluding depr. and amort Cash and cash equivalents 13 298.000 $21,000 $20,000 300,000 3,759 18,000 Short-term investments 3,240 Depreciation and Amortization 19,660 14 15 27.600 Other operating expenses Accounts Receivable 55,500 48,000 22.000 $63,000 6 17 Inventories 84.000 56.000 BT $82,740 Interest Expense Total current assets $164,259 $127,240 5.740 4.470 $58.530 Net fixed assets $77,000 221.400 200,000 T 18 30.800 $385 659 $327240 Taxes (40%) Net Income 9 Total assets 23,412 $35.118 $46.200 20 Liabilities and equity 21 $32,000 22 Accounts payable $33,600 Common dividends $17,262 $18,125 Addition to retained earnings 23 $17,856 $28,075 Accruals 12,600 12,000 Notes payable 19.929 $66,129 24 25 6.480 Total current liabilities Other Data $50,480 2016 2015 67.662 $133,791 $108,800 26 27 Long-term debt 58,320 Year-end Stock Price $90.00 $96.00 #of shares (Thousands) Lease payment (Thousands of Dollars) Total liabilities 4,052 4,000 183,793 178,440 $20,000 $5,000 $20,000 Common stock 28 Retained Earnings 29 68.075 $5,000 40,000 Sinking fund payment (Thousands of Dollar Total common equity $251,868 $218,440 31 Total liabilities and equity $385.659 $327.240 D E F G J 2015 Industry Avg Ratio Analysis 2016 34 35 Liquidity Ratios 36 Current Ratio 2.68 37 1.54 Quick Ratio 38 Asset Management Ratios Inventory Turnover (Total COGS/Inventories) Days Sales Outstanding 39 7.70 40 47.50 41 Debt Management Ratios 42 Debt Ratio (Total debt-to-assets) 21.0% 43 Times-interest-earned ratio 15.33 44 Profitability Ratios Profit Margin 45 8.89% 46 Return on Assets 10.93% 47 Return on Equity 16.10% 48 Market Value Ratios 49 Earnings per share Price-to-earnings ratio Book Value per share NA 50 10.55 51 NA 52 Market-to-book ratio 1,72 53 54 55 G L N O P Liabilities and equity 59 Common Size Balance Sheets 2016 2015 Accounts payable Assets 2016 2015 60 Cash and cash equivalents ccruals 61 Short-term investments Notes payable 62 Accounts Receivable Total current liabilities 63 64 Inventories Long-term debt Total current assets Total liabilities 65 Net fixed assets Common stock 66 Total assets Retained Earnings 67 Total common equity 68 Total liabilities and equity 69 70 Common Size Income Statements 2016 2015 71 Sales 72 Answer: COGS except excluding depr. and amort. Depreciation and Amortization 73 74 Other operating expenses 75 EBIT 76 Interest Expense T Taxes (40%) 77 78 79 Net Income 80
Step by Step Solution
There are 3 Steps involved in it

Get step-by-step solutions from verified subject matter experts