

Question: Calculate the t statistics using formula, with r value calculated in part c)(round to 3 decimal places).ii.Use Excel to find the critical value (round to
Calculate the t statistics using formula, with r value calculated in part c)(round to 3 decimal places).ii.Use Excel to find the critical value (round to 3 decimal places) and state the degree of freedom.??.Conclusion on the significance of the correlation?
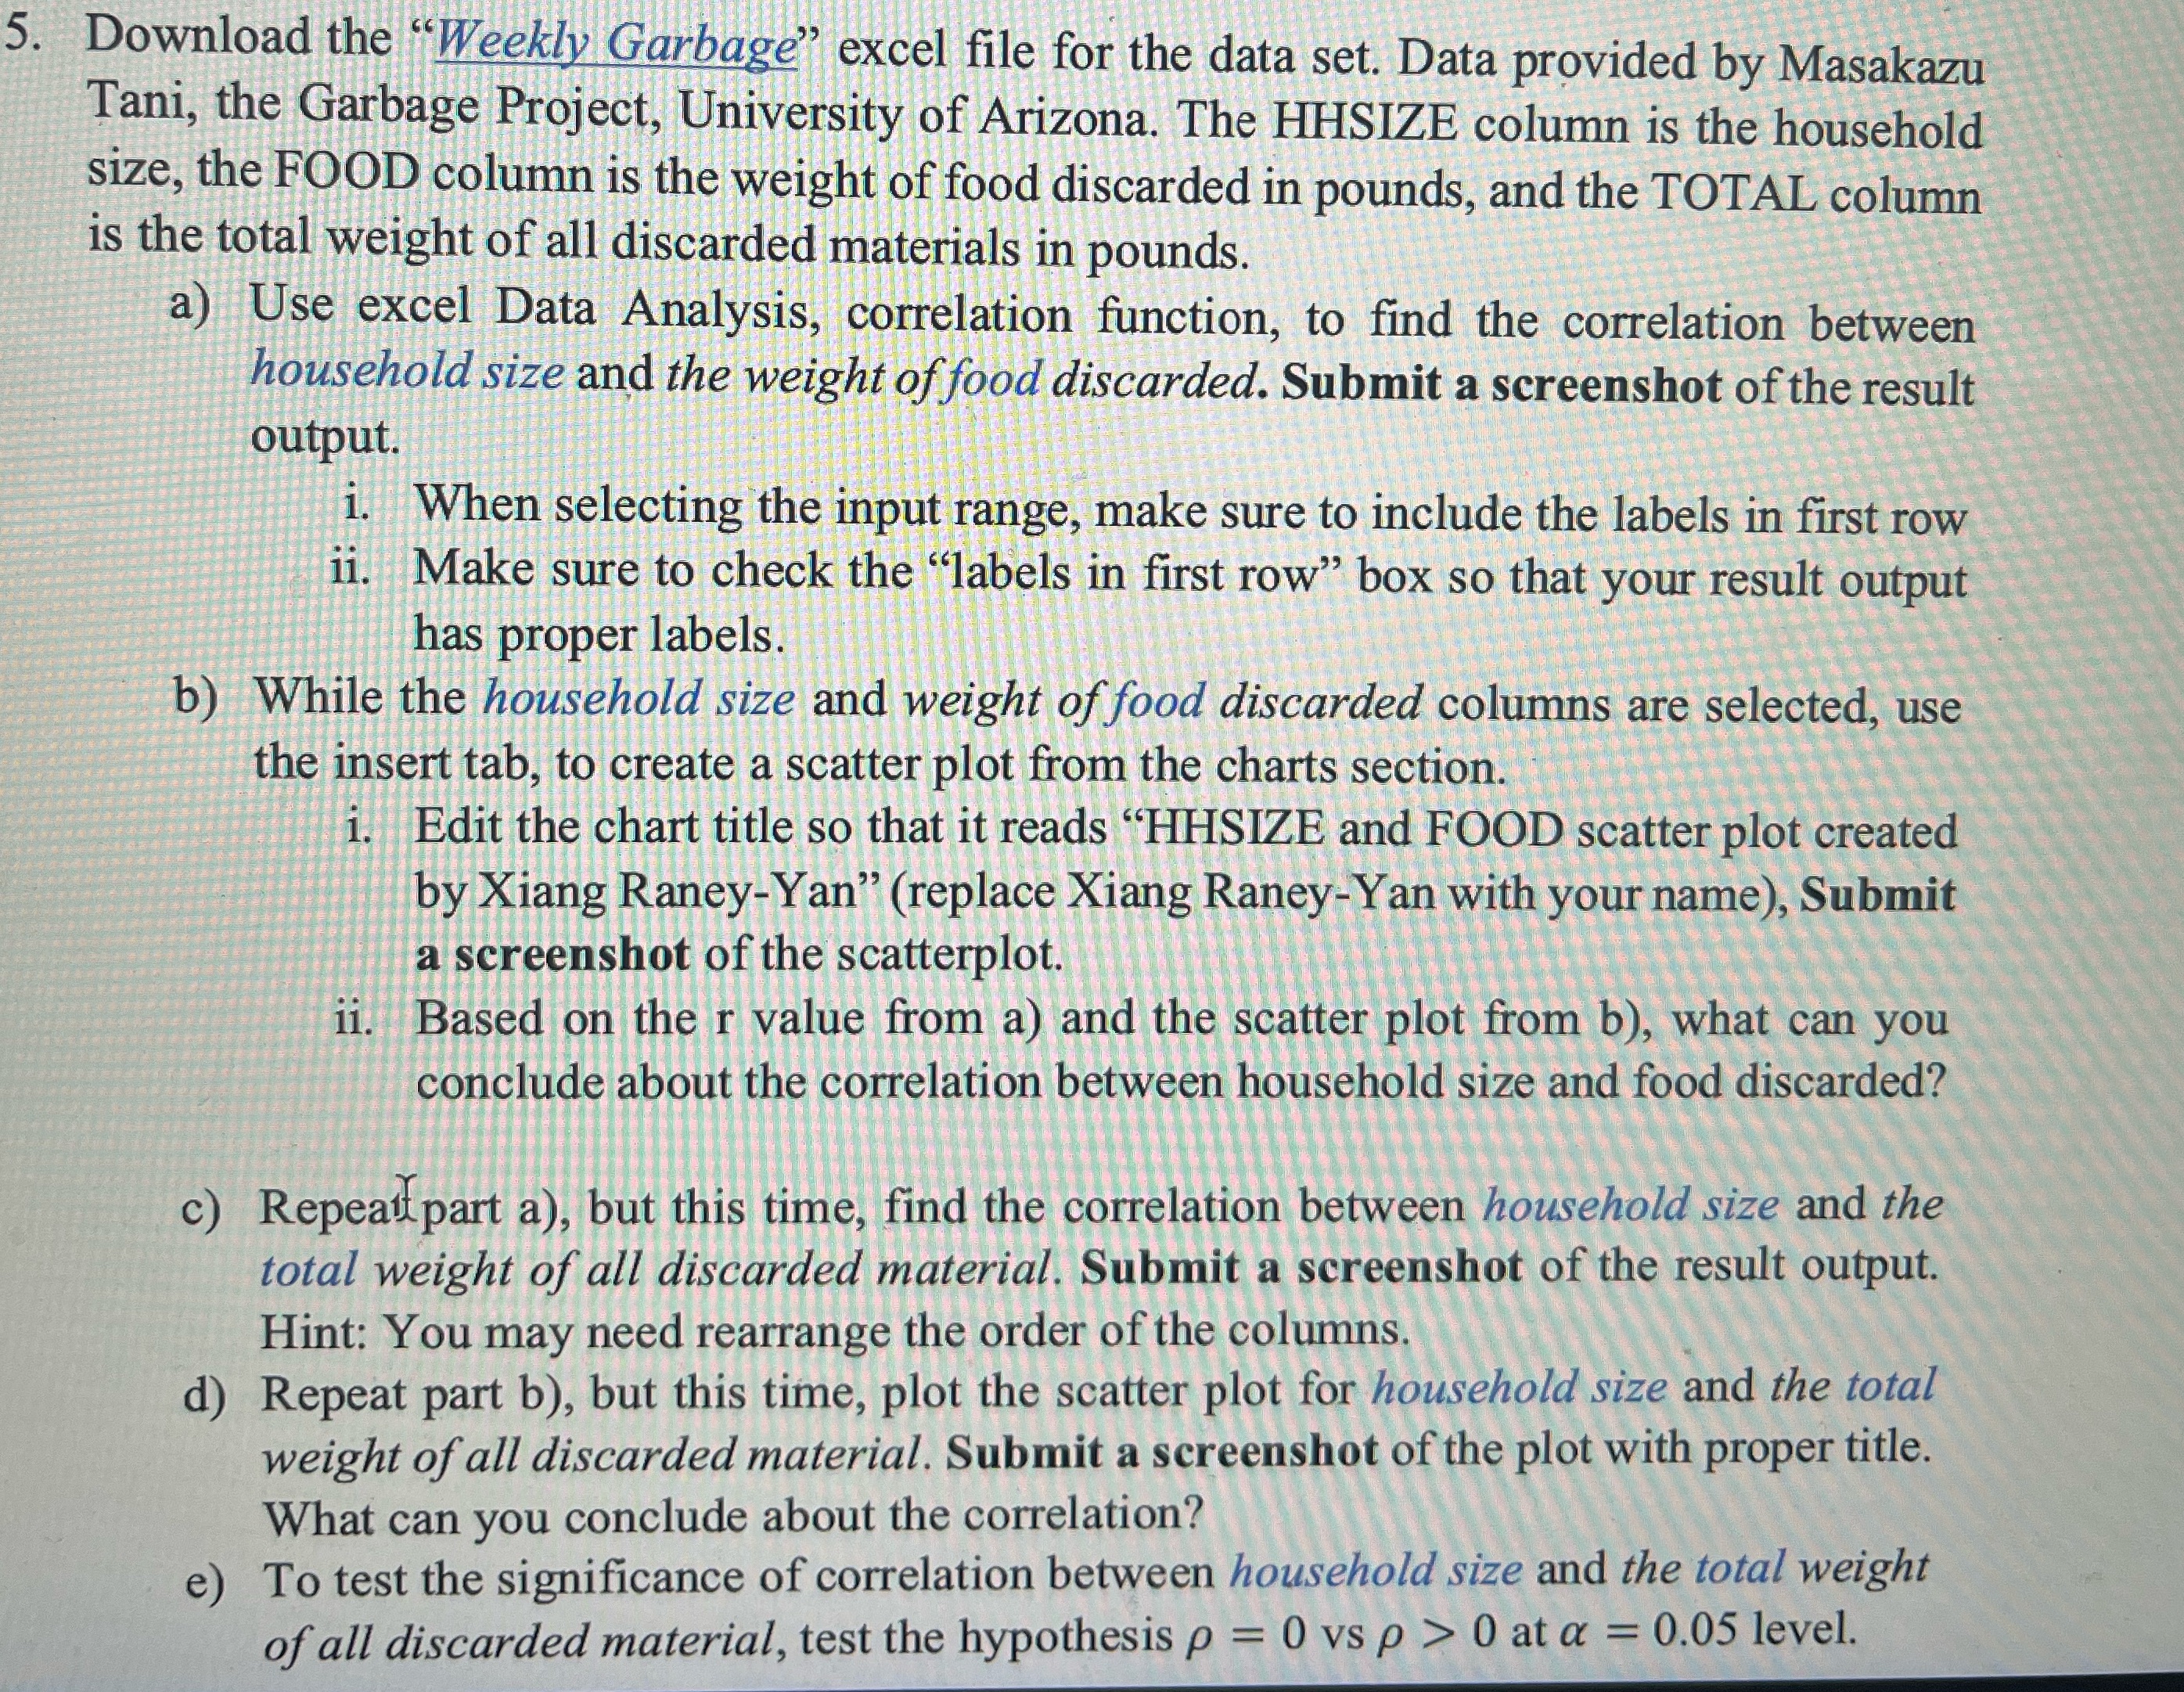
5. Download the "Weekly Garbage" excel file for the data set. Data provided by Masakazu Tani, the Garbage Project, University of Arizona. The HHSIZE column is the household size, the FOOD column is the weight of food discarded in pounds, and the TOTAL column is the total weight of all discarded materials in pounds. a) Use excel Data Analysis, correlation function, to find the correlation between household size and the weight of food discarded. Submit a screenshot of the result output. i. When selecting the input range, make sure to include the labels in first row ii. Make sure to check the "labels in first row" box so that your result output has proper labels. b) While the household size and weight of food discarded columns are selected, use the insert tab, to create a scatter plot from the charts section. i. Edit the chart title so that it reads "HHSIZE and FOOD scatter plot created by Xiang Raney-Yan" (replace Xiang Raney-Yan with your name), Submit a screenshot of the scatterplot. ii. Based on the r value from a) and the scatter plot from b), what can you conclude about the correlation between household size and food discarded? c) Repeat part a), but this time, find the correlation between household size and the total weight of all discarded material. Submit a screenshot of the result output. Hint: You may need rearrange the order of the columns. d) Repeat part b), but this time, plot the scatter plot for household size and the total weight of all discarded material. Submit a screenshot of the plot with proper title. What can you conclude about the correlation? e) To test the significance of correlation between household size and the total weight of all discarded material, test the hypothesis p = 0 vs p > 0 at a = 0.05 level
Step by Step Solution
There are 3 Steps involved in it

Get step-by-step solutions from verified subject matter experts