

Question: calculate the yellow highlighted fields. 1 2 A 3 B Name: C D E F G Peter Pan Your score: 0% The Peter Pan Company
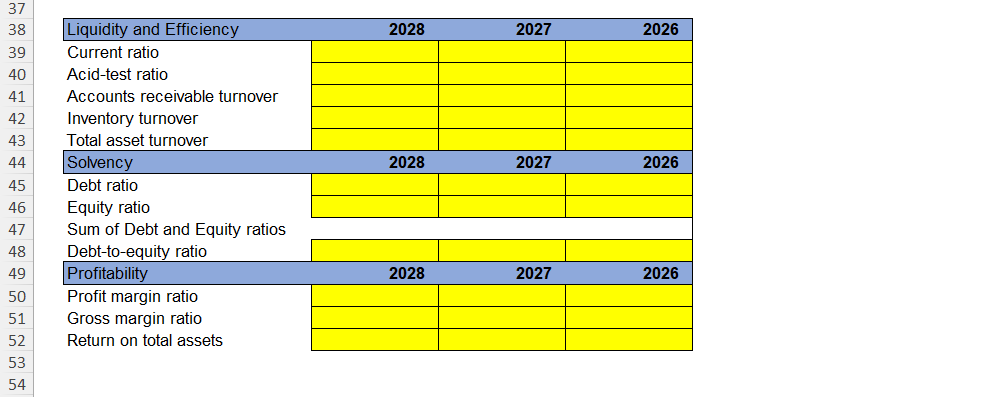
calculate the yellow highlighted fields.
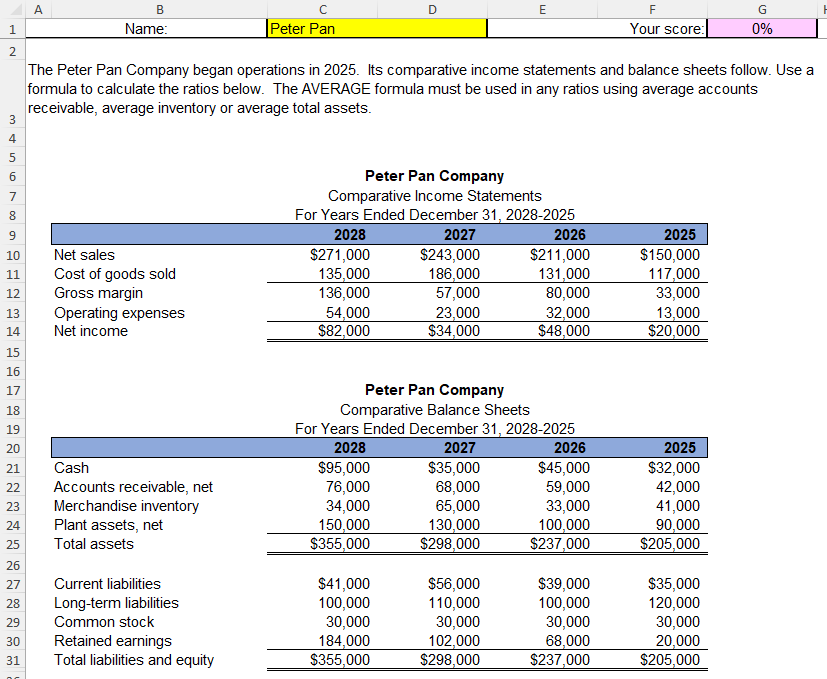
1 2 A 3 B Name: C D E F G Peter Pan Your score: 0% The Peter Pan Company began operations in 2025. Its comparative income statements and balance sheets follow. Use a formula to calculate the ratios below. The AVERAGE formula must be used in any ratios using average accounts receivable, average inventory or average total assets. 456 7 8 00 Peter Pan Company Comparative Income Statements For Years Ended December 31, 2028-2025 9 2028 2027 10 Net sales $271,000 $243,000 2026 $211,000 2025 $150,000 11 Cost of goods sold 135,000 186,000 131,000 117,000 12 Gross margin 136,000 57,000 80,000 33,000 13 Operating expenses 54,000 23,000 32,000 13,000 14 Net income $82,000 $34,000 $48,000 $20,000 15 16 17 18 19 Peter Pan Company Comparative Balance Sheets For Years Ended December 31, 2028-2025 20 2028 2027 2026 2025 222222222 21 Cash $95,000 $35,000 $45,000 $32,000 Accounts receivable, net 76,000 68,000 59,000 42,000 23 Merchandise inventory 34,000 65,000 33,000 41,000 24 Plant assets, net 25 Total assets 150,000 130,000 100,000 90,000 $355,000 $298,000 $237,000 $205,000 26 27 Current liabilities Long-term liabilities 28 29 Common stock $41,000 $56,000 $39,000 $35,000 100,000 110,000 100,000 120,000 30,000 30,000 30,000 30,000 30 Retained earnings 184,000 102,000 68,000 20,000 31 Total liabilities and equity $355,000 $298,000 $237,000 $205,000
Step by Step Solution
There are 3 Steps involved in it

Get step-by-step solutions from verified subject matter experts