

Question: Calculating Market Demand The Industry Demand Analysis will help the Marketing and Production Departments understand future demand. Marketing can use the total demand for each
Calculating Market Demand
The Industry Demand Analysis will help the Marketing and Production Departments understand future demand. Marketing can use the total demand for each segment as it creates a sales forecast. Production can use the results when making capacity buy and sell decisions. You will need:
- The Segment Analysis reports (pages 5-9) of the Capstone Courier for Round 0
- The Industry Conditions Report.
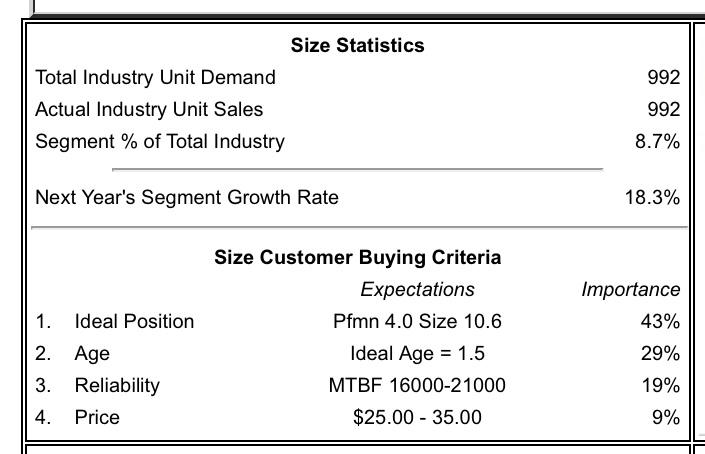
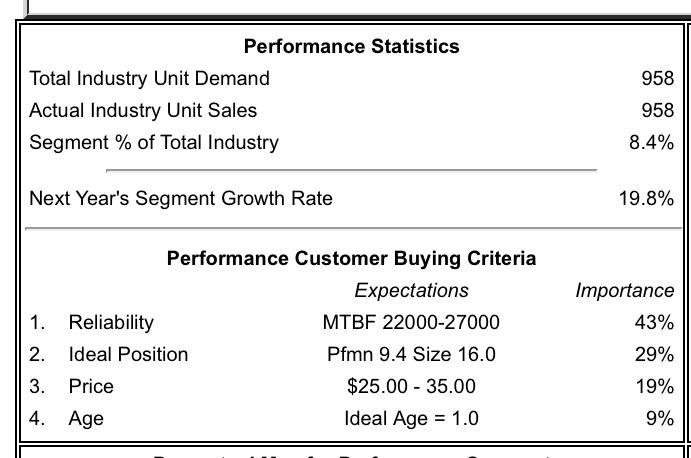
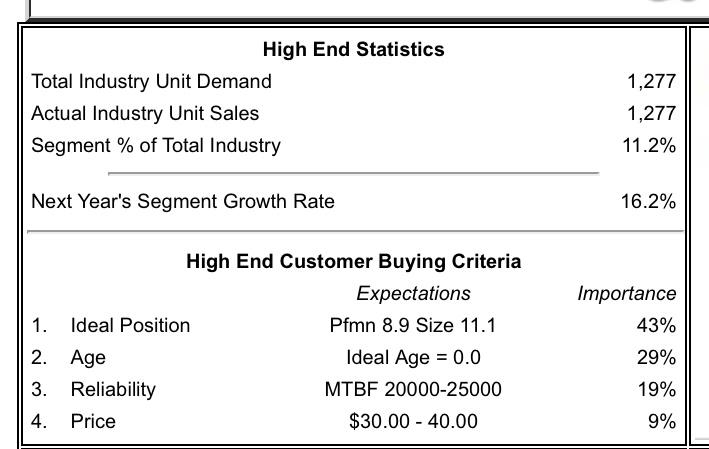
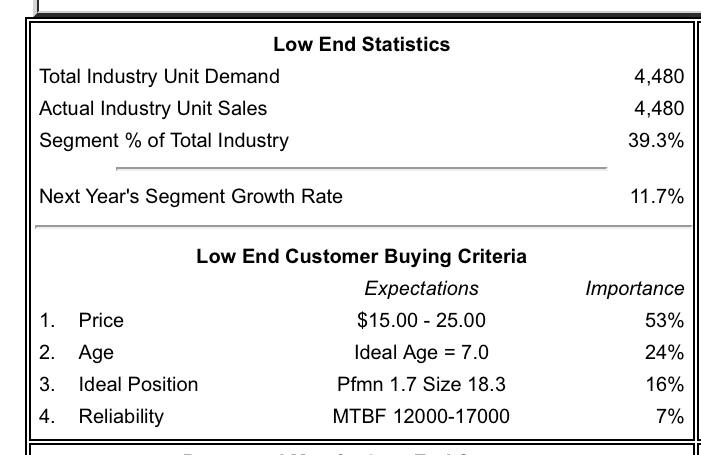
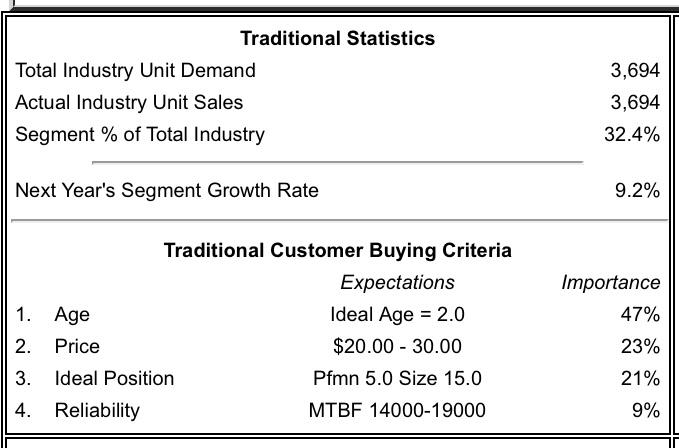
- At the top of each Segment Analysis page you will find each segments statistics (see example below). The top line is the total demand for the segment for last year (the Courier reports last years data). The fourth line tells you next years growth rate for the segment. To find out the coming years total demand, simply apply the growth rate to last years total demand.
* The above growth and demand figures are for example only. Your industry growth rates and demand may differ, but the process to calculate next years total segment demand is identical.
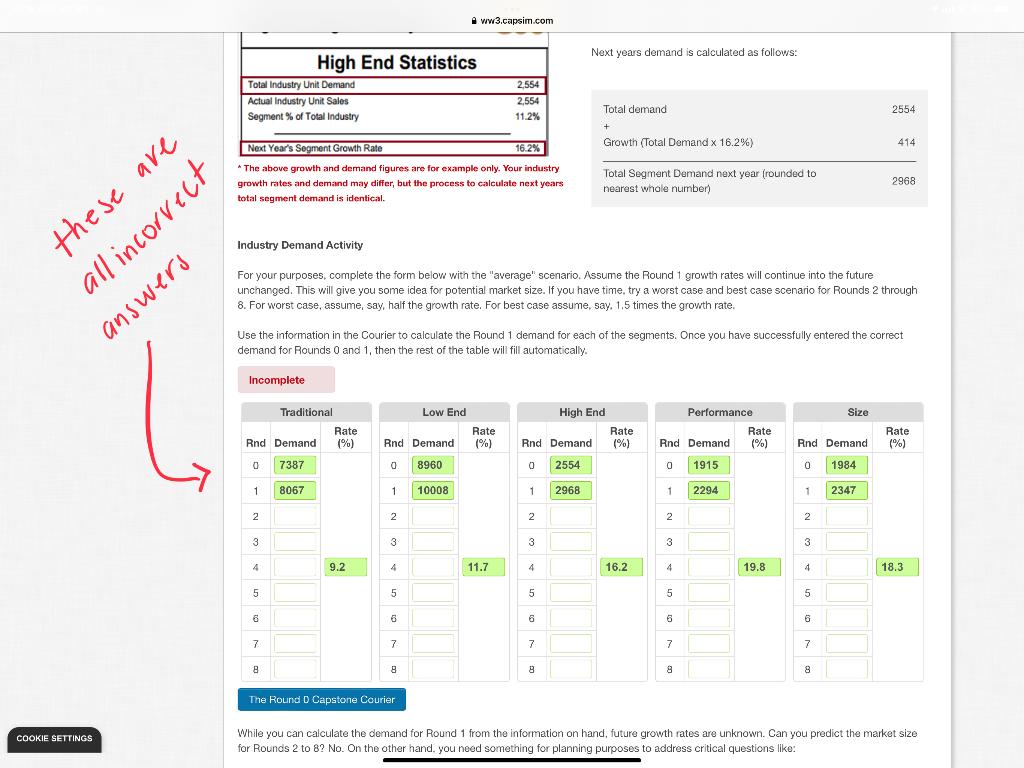
For example, in the High End segment analysis on the left, Total Demand is 2554 and next years growth rate is 16.2% Next years demand is calculated as follows:
| Total demand | 2554 |
| + | |
| Growth (Total Demand x 16.2%) | 414 |
| Total Segment Demand next year (rounded to nearest whole number) | 2968 |
Industry Demand Activity
For your purposes, complete the form below with the "average" scenario. Assume the Round 1 growth rates will continue into the future unchanged. This will give you some idea for potential market size. If you have time, try a worst case and best case scenario for Rounds 2 through 8. For worst case, assume, say, half the growth rate. For best case assume, say, 1.5 times the growth rate. Use the information in the Courier to calculate the Round 1 demand for each of the segments. Once you have successfully entered the correct demand for Rounds 0 and 1, then the rest of the table will fill automatically.
Thank you and Please note that the answers filed in already are incorrect.
992 Size Statistics Total Industry Unit Demand Actual Industry Unit Sales Segment % of Total Industry 992 8.7% Next Year's Segment Growth Rate 18.3% 1. Ideal Position 2. Age 3. Reliability 4. Price Size Customer Buying Criteria Expectations Pfmn 4.0 Size 10.6 Ideal Age = 1.5 MTBF 16000-21000 $25.00 - 35.00 Importance 43% 29% 19% 9% 958 Performance Statistics Total Industry Unit Demand Actual Industry Unit Sales Segment % of Total Industry 958 8.4% Next Year's Segment Growth Rate 19.8% Importance 43% Performance Customer Buying Criteria Expectations 1. Reliability MTBF 22000-27000 2. Ideal Position Pfmn 9.4 Size 16.0 3. Price $25.00 - 35.00 4. Age Ideal Age = 1.0 29% 19% = 9% High End Statistics Total Industry Unit Demand Actual Industry Unit Sales Segment % of Total Industry 1,277 1,277 11.2% Next Year's Segment Growth Rate 16.2% Importance 43% High End Customer Buying Criteria Expectations 1. Ideal Position Pfmn 8.9 Size 11.1 2. Age Ideal Age = 0.0 3. Reliability MTBF 20000-25000 4. Price $30.00 - 40.00 29% 19% 9% Low End Statistics Total Industry Unit Demand Actual Industry Unit Sales Segment % of Total Industry 4,480 4,480 39.3% Next Year's Segment Growth Rate 11.7% Low End Customer Buying Criteria Expectations 1. Price $15.00 - 25.00 2. Age Ideal Age = 7.0 3. Ideal Position Pfmn 1.7 Size 18.3 4. Reliability MTBF 12000-17000 Importance 53% 24% 16% 7% Traditional Statistics Total Industry Unit Demand Actual Industry Unit Sales Segment % of Total Industry 3,694 3,694 32.4% Next Year's Segment Growth Rate 9.2% Traditional Customer Buying Criteria Expectations 1. Age Ideal Age = 2.0 2. Price $20.00 - 30.00 3. Ideal Position Pfmn 5.0 Size 15.0 4. Reliability MTBF 14000-19000 Importance 47% 23% 21% 9% Ww3.capsim.com Next years demand is calculated as follows: High End Statistics Total Industry Unit Demand Actual Industry Unit Sales Segment % of Total Industry 2,554 2,554 112% Total demand 2554 + Growth (Total Demand x 16.2%) ) 414 Next Year's Segment Growth Rate 16.2% * The above growth and demand figures are for example only. Your industry growth rates and demand may differ, but the process to calculate next years total segment demand is identical. Total Segment Demand next year (rounded to nearest whole number) ) 2968 these are ill incorrect Industry Demand Activity For your purposes, complete the form below with the "average" scenario. Assume the Round 1 growth rates will continue into the future unchanged. This will give you some idea for potential market size. If you have time, try a worst case and best case scenario for Rounds 2 through 8. For worst case, assume, say, half the growth rate. For best case assume, say, 1,5 times the growth rate. answers Use the information in the Courier to calculate the Round 1 demand for each of the segments. Once you have successfully entered the correct demand for Rounds 0 and 1, then the rest of the table will fill automatically. Incomplete Traditional Low End Performance Size Rate (%) Rnd Demand High End Rate Rnd Demand (%) Rate (%) Rnd Demand Rnd Demand Rate (%) And Demand Rate (%) 0 0 7387 0 8960 0 2554 0 1915 0 1984 1 1 8067 1 10008 1 2968 1 2294 1 2347 2 2 2 2 2 2 2 3 3 3 3 3 4 9.2 4 11.7 4 4 16.2 4 19.8 4 18.3 5 5 5 5 5 6 6 6 6 6 6 7 7 7 7 7 7 8 8 8 g 8 8 The Round Capstone Courier COOKIE SETTINGS While you can calculate the demand for Round 1 from the information on hand, future growth rates are unknown. Can you predict the market size for Rounds 2 to 8? No. On the other hand, you need something for planning purposes to address critical questions like: 992 Size Statistics Total Industry Unit Demand Actual Industry Unit Sales Segment % of Total Industry 992 8.7% Next Year's Segment Growth Rate 18.3% 1. Ideal Position 2. Age 3. Reliability 4. Price Size Customer Buying Criteria Expectations Pfmn 4.0 Size 10.6 Ideal Age = 1.5 MTBF 16000-21000 $25.00 - 35.00 Importance 43% 29% 19% 9% 958 Performance Statistics Total Industry Unit Demand Actual Industry Unit Sales Segment % of Total Industry 958 8.4% Next Year's Segment Growth Rate 19.8% Importance 43% Performance Customer Buying Criteria Expectations 1. Reliability MTBF 22000-27000 2. Ideal Position Pfmn 9.4 Size 16.0 3. Price $25.00 - 35.00 4. Age Ideal Age = 1.0 29% 19% = 9% High End Statistics Total Industry Unit Demand Actual Industry Unit Sales Segment % of Total Industry 1,277 1,277 11.2% Next Year's Segment Growth Rate 16.2% Importance 43% High End Customer Buying Criteria Expectations 1. Ideal Position Pfmn 8.9 Size 11.1 2. Age Ideal Age = 0.0 3. Reliability MTBF 20000-25000 4. Price $30.00 - 40.00 29% 19% 9% Low End Statistics Total Industry Unit Demand Actual Industry Unit Sales Segment % of Total Industry 4,480 4,480 39.3% Next Year's Segment Growth Rate 11.7% Low End Customer Buying Criteria Expectations 1. Price $15.00 - 25.00 2. Age Ideal Age = 7.0 3. Ideal Position Pfmn 1.7 Size 18.3 4. Reliability MTBF 12000-17000 Importance 53% 24% 16% 7% Traditional Statistics Total Industry Unit Demand Actual Industry Unit Sales Segment % of Total Industry 3,694 3,694 32.4% Next Year's Segment Growth Rate 9.2% Traditional Customer Buying Criteria Expectations 1. Age Ideal Age = 2.0 2. Price $20.00 - 30.00 3. Ideal Position Pfmn 5.0 Size 15.0 4. Reliability MTBF 14000-19000 Importance 47% 23% 21% 9% Ww3.capsim.com Next years demand is calculated as follows: High End Statistics Total Industry Unit Demand Actual Industry Unit Sales Segment % of Total Industry 2,554 2,554 112% Total demand 2554 + Growth (Total Demand x 16.2%) ) 414 Next Year's Segment Growth Rate 16.2% * The above growth and demand figures are for example only. Your industry growth rates and demand may differ, but the process to calculate next years total segment demand is identical. Total Segment Demand next year (rounded to nearest whole number) ) 2968 these are ill incorrect Industry Demand Activity For your purposes, complete the form below with the "average" scenario. Assume the Round 1 growth rates will continue into the future unchanged. This will give you some idea for potential market size. If you have time, try a worst case and best case scenario for Rounds 2 through 8. For worst case, assume, say, half the growth rate. For best case assume, say, 1,5 times the growth rate. answers Use the information in the Courier to calculate the Round 1 demand for each of the segments. Once you have successfully entered the correct demand for Rounds 0 and 1, then the rest of the table will fill automatically. Incomplete Traditional Low End Performance Size Rate (%) Rnd Demand High End Rate Rnd Demand (%) Rate (%) Rnd Demand Rnd Demand Rate (%) And Demand Rate (%) 0 0 7387 0 8960 0 2554 0 1915 0 1984 1 1 8067 1 10008 1 2968 1 2294 1 2347 2 2 2 2 2 2 2 3 3 3 3 3 4 9.2 4 11.7 4 4 16.2 4 19.8 4 18.3 5 5 5 5 5 6 6 6 6 6 6 7 7 7 7 7 7 8 8 8 g 8 8 The Round Capstone Courier COOKIE SETTINGS While you can calculate the demand for Round 1 from the information on hand, future growth rates are unknown. Can you predict the market size for Rounds 2 to 8? No. On the other hand, you need something for planning purposes to address critical questions like
Step by Step Solution
There are 3 Steps involved in it

Get step-by-step solutions from verified subject matter experts