

Question: Calculation for the 2020 data. ert Draw Design Layout References Mailings Review View Tell me Share Comments V 12 Times New... A A A A
Calculation for the 2020 data.
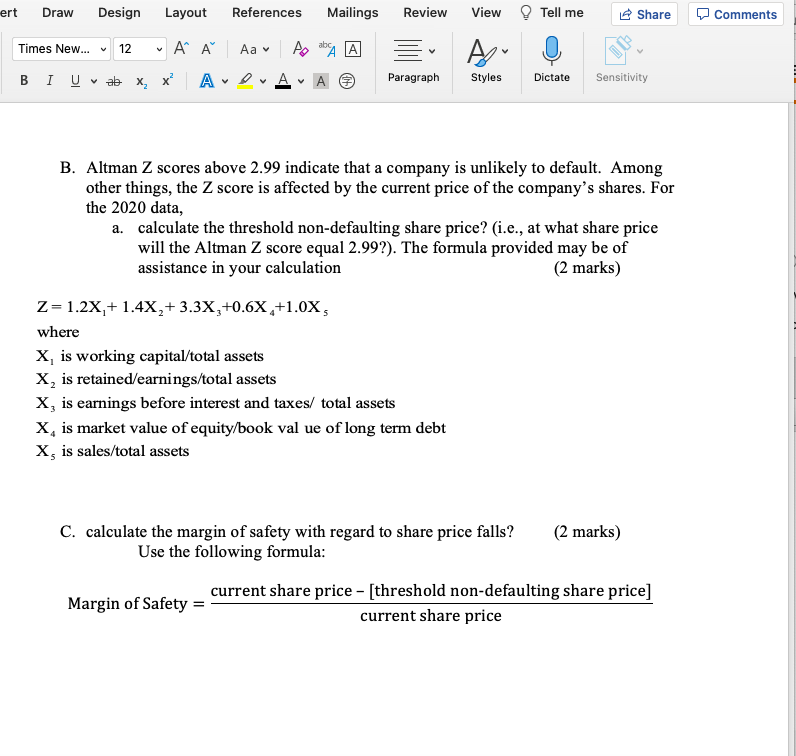
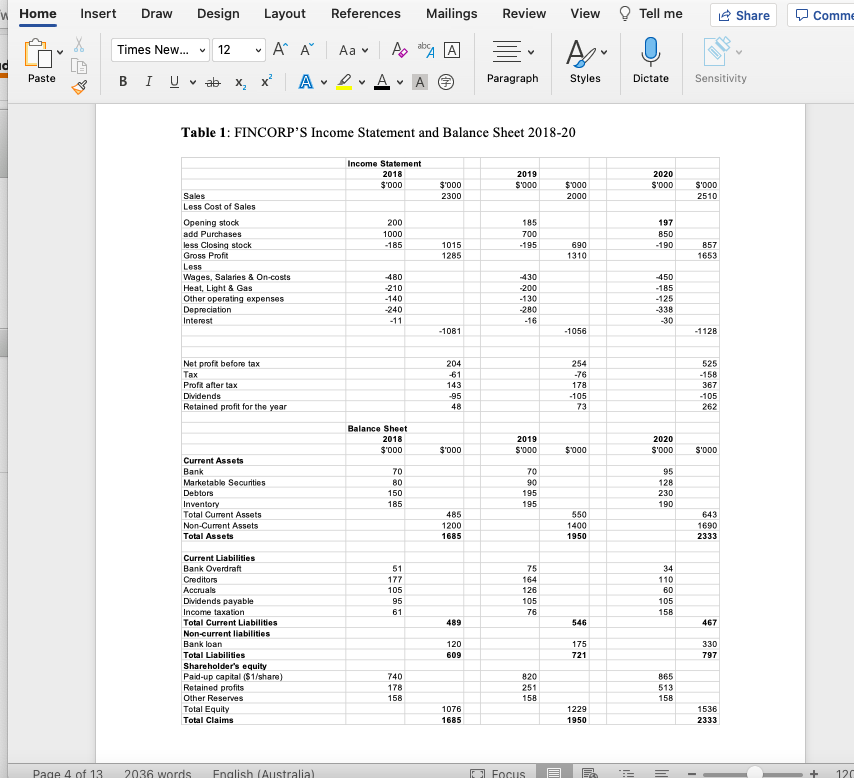
ert Draw Design Layout References Mailings Review View Tell me Share Comments V 12 Times New... A A A A ab X, X? A DA A Paragraph Styles Dictate Sensitivity B. Altman Z scores above 2.99 indicate that a company is unlikely to default. Among other things, the Z score is affected by the current price of the company's shares. For the 2020 data, a. calculate the threshold non-defaulting share price? (i.e., at what share price will the Altman Z score equal 2.99?). The formula provided may be of assistance in your calculation (2 marks) Z=1.2X,+1.4X,+ 3.3X, +0.6x +1.0X, where X, is working capital/total assets X, is retained/earnings/total assets X, is earnings before interest and taxes/ total assets X, is market value of equity/book value of long term debt X, is sales/total assets C. calculate the margin of safety with regard to share price falls? Use the following formula: (2 marks) Margin of Safety = current share price - [threshold non-defaulting share price] current share price Home Insert Draw Design Layout References Mailings Review View Tell me Share Comme X abc Times New... 12 . AI Aa v Arab A Paste vab X, X? A V V A Paragraph Styles Sensitivity Dictate Table 1: FINCORP'S Income Statement and Balance Sheet 2018-20 Income Statement 2018 $'000 2019 S'000 2020 S'000 $'000 2300 $000 2000 S'000 2510 185 200 1000 -185 700 197 850 -190 -195 Sales Less Cost of Sales Opening stock add Purchases less Closing stock Gross Profit Less Wages, Salaries & On-costs Heat, Light & Gas Other operating expenses Depreciation Interest 1015 1285 690 1310 857 1653 480 -210 -140 -240 -11 430 -200 -130 -280 -16 450 -185 -125 -338 -30 -1081 -1056 -1128 254 Net proft before tax Tax Proff after tax Dividends Retained profit for the year 204 -61 143 -95 48 178 -105 73 525 -158 367 -105 262 Balance Sheet 2018 $'000 2019 S'000 2020 S'000 $'000 $000 S'OOD 70 80 150 Current Assets Bank Marketable Securities Debtors Inventory Total Current Assets Non-Current Assets Total Assets 70 90 195 195 95 128 230 190 185 485 1200 1685 550 1400 1950 643 1690 2333 51 177 105 95 61 75 164 126 105 76 34 110 60 105 156 489 546 467 Current Liabilities Bank Overdraft Creditors Accruals Dividends payable Income taxation Total Current Liabilities Non-current liabilities Bank loan Total Liabilities Shareholder's equity Paid-up capital ($1/share) Retained profits Other Reserves Total Equity Total Claims 120 609 175 721 330 797 740 178 158 820 251 158 865 513 158 1076 1685 1229 1950 1536 2333 Page 4 of 13 2036 words English (Australia) Focus 120
Step by Step Solution
There are 3 Steps involved in it

Get step-by-step solutions from verified subject matter experts