

Question: CALCULATOR PRINTER VERSION BACK NEX Problem 2-04A Comparative financial statement data for Sheridan Company and Ivanhoe Company, two competitors, appear below. All balance sheet data
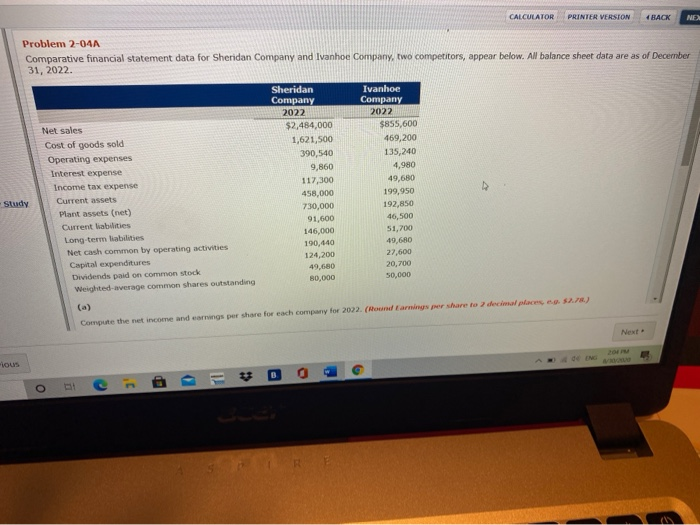
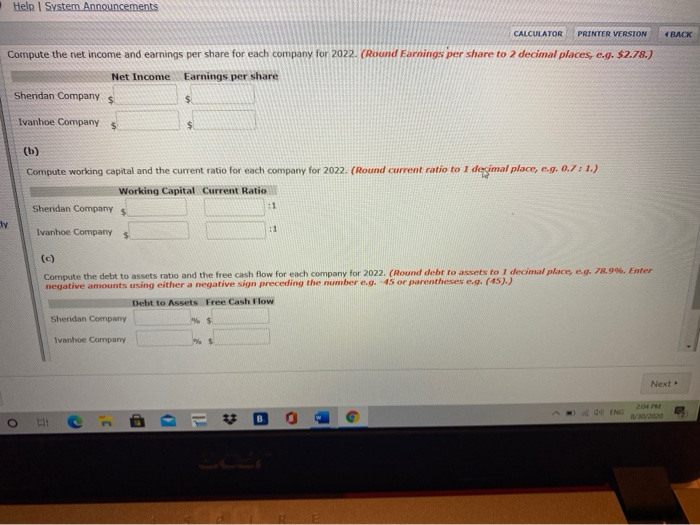
CALCULATOR PRINTER VERSION BACK NEX Problem 2-04A Comparative financial statement data for Sheridan Company and Ivanhoe Company, two competitors, appear below. All balance sheet data are as of December 31, 2022. Sheridan Company 2022 $2,484,000 1,621,500 390,540 9,860 117,300 458,000 730,000 91,600 146,000 190,440 124,200 49,680 80,000 Net sales Cost of goods sold Operating expenses Interest expense Income tax expense Current assets Plant assets (net) Current liabilities Long-term liabilities Net cash common by operating activities Capital expenditures Dividends paid on common stock Weighted average common shares outstanding Ivanhoe Company 2022 $855,600 469,200 135, 240 4,980 49,680 199,950 192,850 46,500 51,700 49,650 22,600 20,700 50,000 Study Compute the net income and carings per share for each company for 2022. (Hound Earnings per share to decimal places, 2.7.) Next tous - 1 O Help System Announcements CALCULATOR PRINTER VERSION { BACK Compute the net income and earnings per share for each company for 2022. (Round Earnings per share to 2 decimal places, e.g. $2.78.) Net Income Earnings per share Sheridan Company $ $ Ivanhoe Company $ $ (b) Compute working capital and the current ratio for each company for 2022. (Round current ratio to I desimal place, e.g. 0.7: 1.) Working Capital Current Ratio Sheridan Company $ :1 ly :1 Ivanhoe Company $ Compute the debt to assets ratio and the free cash flow for each company for 2022. (Round debt to assets to I decimal places e.. 78.9%. Enter negative amounts using either a negative sign preceding the number .45 or parentheses e.o. (45).) Debt to Assets Free Cash Flow Sheridan Company % $ Ivanhoe Company %$ Next o B
Step by Step Solution
There are 3 Steps involved in it

Get step-by-step solutions from verified subject matter experts