

Question: Caltron Ltd. is 100 per cent owned by Pulsar Computer, which is one of the leading computer makers in North America. Caltron was started in
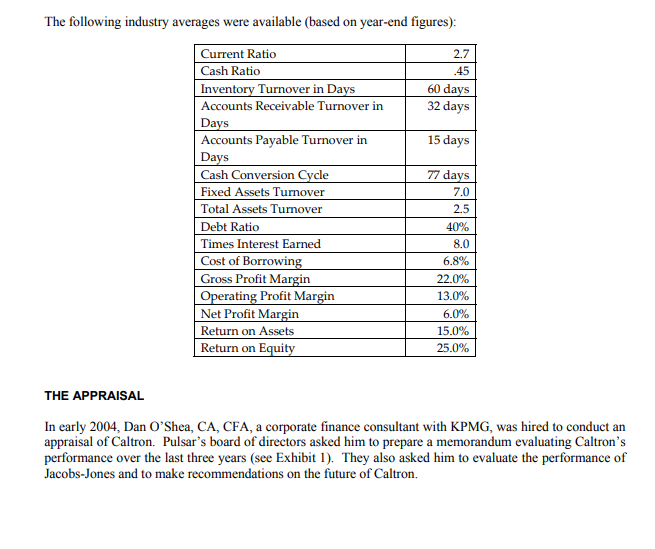
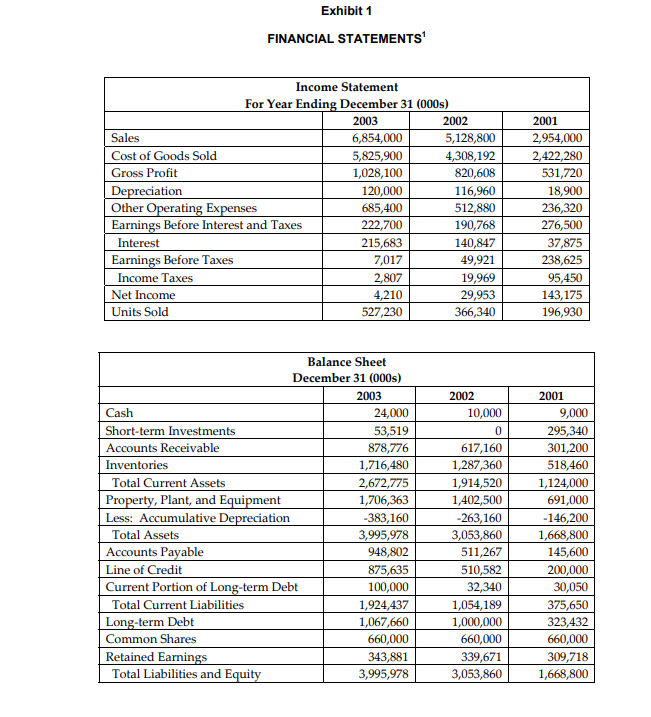
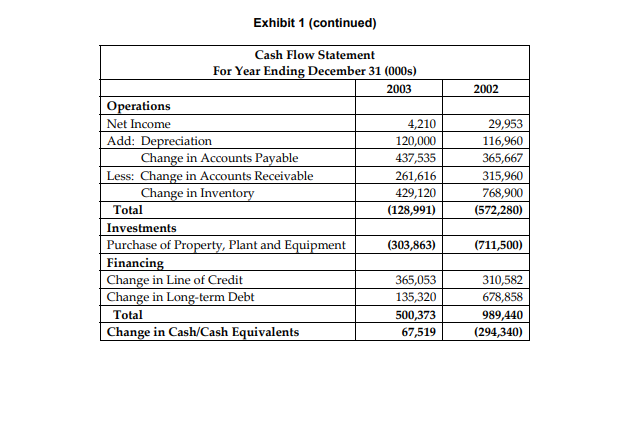
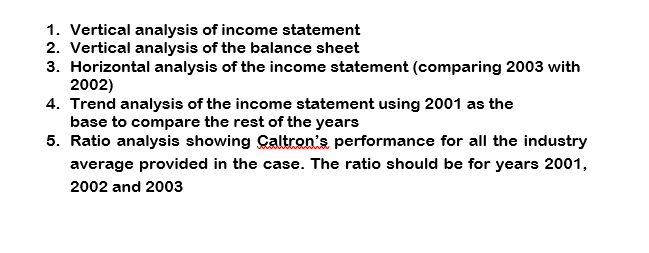
Caltron Ltd. is 100 per cent owned by Pulsar Computer, which is one of the leading computer makers in North America. Caltron was started in 1971 by Pulsar's founder, Jenny Jones, to supply electronic calculators to the scientific and business communities. When microcomputers were first developed in the early 1980s, Jones started Pulsar, and despite rigorous competition and merciless industry consolidation, it managed to survive as a very profitable computer maker. Even with the rapid growth of the microcomputer industry, Pulsar retained ownership of Caltron. Jenny Jones was very attached to this unit for sentimental reasons and in 1999, as chairman and chief executive officer (CEO) of Pulsar, had even appointed her daughter-in-law, Kyla Jacobs-Jones, a recent MBA graduate, as the unit president. The board of directors was not impressed with this obvious nepotism, but Jones insisted and they relented. ON PROBATION During 2001, Jones began to feel pressure from some of the independent board members to divest Caltron because of its poor financial performance compared to other calculator makers. Old equipment, poor factory operations, an expensive unionized workforce, and intense competition from low-wage developing countries were at the root of the company's problems. Anxious to appease the other directors and test the management skills of her new daughter-in-law, Jones put Jacobs-Jones on notice that if she wanted to stay with the company, she would have to prove herself and turn this unit around. She was to have two years and complete autonomy over the plan of action, but would not receive any financial help from Pulsar. In two years, the company's financial health would be reviewed and a decision made about Jacobs-Jones and the unit's future. OPERATIONAL ISSUES When the electronic calculator was first introduced in the early 1970s, it was a high-margin item sold through specialty electronic and office supply stores. Since then, the product has become a commodity with steadily declining prices and gross margins. Initially, North American producers contracted out component production to remain competitive with foreign producers, but now nearly all companies have moved assembly abroad to capitalize on the low-labor rates. A high-volume, low-cost strategy is the norm in the industry. Out of loyalty to the workforce, Caltron has maintained calculator assembly operations in North America, and hopes to overcome the labor rate disadvantage through factory automation. In 2002 and 2003, it invested heavily in new equipment to greatly expand capacity and reduce labor costs. Initially, the new production systems were difficult to install and worker training was more time consuming than expected due to low education levels among the workers, but by 2003 factory operations were improving. Due to the greatly expanded production, even with the high degree of automation in the renovated factory, no layoffs were required Calculators came in a number of different models and were produced in large batches requiring that extensive finished goods inventories be carried. There were also large component inventories to guard against supply interruptions from overseas suppliers. Now that the new manufacturing equipment was fully operational, Jacobs-Jones was wondering whether these inventories could be better managed. In order to sell all the extra output, Caltron had to significantly expand its sales force and administrative staff. Manufacturing, selling and administration workers belonged to the same union. The sales force was on straight salary as per the collective agreement. Surprisingly, Caltron's administrative offices were not highly automated. FINANCIAL SITUATION All calculator sales were made to retailers or wholesalers at net 30. Officially, Caltron charged interest on overdue accounts, but had not been enforcing that rule in attempts to expand sales to match the new capacity. Most components and supplies were purchased on the terms 2/10, net 30. Interest was paid when the company took longer than 30 days. Caltron had a $1,000,000 line of credit with the Bank of Montreal. The company had to maintain a coverage ratio of 2.0 with accounts receivable being valued at 75 per cent and inventory at 50 per cent. A current ratio of 1.5 was also required and a times interest earned ratio of at least 2.0. Caltron could negotiate a line of credit of more than $1,000,000, but the bank would only authorize it if the institution had sufficient loanable funds and the company was in good financial condition. The economy was just entering what was expected to be a mild recession. All dividend payments to Pulsar were suspended in 2001 in anticipation of the plant modernization and expansion The following industry averages were available (based on year-end figures): 2.7 45 Current Ratio Cash Ratio Inventory Turnover in Days Accounts Receivable Turnover in 60 days 32 days Days 15 days Accounts Payable Turnover in Days Cash Conversion Cycle Fixed Assets Turnover Total Assets Turnover Debt Ratio Times Interest Earned Cost of Borrowing Gross Profit Margin Operating Profit Margin Net Profit Margin Return on Assets Return on Equity 77 days 7.0 2.5 40% 8.0 6.8% 22.0% 13.0% 6.0% 15.0% 25.0% THE APPRAISAL In early 2004, Dan O'Shea, CA, CFA, a corporate finance consultant with KPMG, was hired to conduct an appraisal of Caltron. Pulsar's board of directors asked him to prepare a memorandum evaluating Caltron's performance over the last three years (see Exhibit 1). They also asked him to evaluate the performance of Jacobs-Jones and to make recommendations on the future of Caltron. Exhibit 1 FINANCIAL STATEMENTS Income Statement For Year Ending December 31 (000s) 2003 2002 Sales 6,854,000 5,128,800 Cost of Goods Sold 5,825,900 4,308,192 Gross Profit 1,028,100 820,608 Depreciation 120,000 116,960 Other Operating Expenses 685,400 512,880 Earnings Before Interest and Taxes 222,700 190,768 Interest 215,683 140,847 Earnings Before Taxes 7,017 49,921 Income Taxes 2,807 19,969 Net Income 4,210 29,953 Units Sold 527,230 366,340 2001 2,954,000 2,422,280 531,720 18,900 236,320 276,500 37,875 238,625 95,450 143,175 196,930 Balance Sheet December 31 (000s) 2003 Cash 24,000 Short-term Investments 53,519 Accounts Receivable 878,776 Inventories 1,716,480 Total Current Assets 2,672,775 Property, Plant, and Equipment 1,706,363 Less: Accumulative Depreciation -383,160 Total Assets 3,995,978 Accounts Payable 948,802 Line of Credit 875,635 Current Portion of Long-term Debt 100,000 Total Current Liabilities 1,924,437 Long-term Debt 1,067,660 Common Shares 660,000 Retained Earnings 343,881 Total Liabilities and Equity 3,995,978 2002 10,000 0 617,160 1,287,360 1,914,520 1,402,500 -263,160 3,053,860 511,267 510,582 32,340 1,054,189 1,000,000 660,000 339,671 3,053,860 2001 9,000 295,340 301,200 518,460 1,124,000 691,000 -146,200 1,668,800 145,600 200,000 30,050 375,650 323,432 660,000 309,718 1,668,800 Exhibit 1 (continued) 2002 Cash Flow Statement For Year Ending December 31 (000s) 2003 Operations Net Income 4,210 Add: Depreciation 120,000 Change in Accounts Payable 437,535 Less: Change in Accounts Receivable 261,616 Change in Inventory 429,120 Total (128,991) Investments Purchase of Property, Plant and Equipment (303,863) Financing Change in Line of Credit 365,053 Change in Long-term Debt 135,320 Total 500,373 Change in Cash/Cash Equivalents 67,519 29,953 116,960 365,667 315,960 768,900 (572,280) (711,500) 310,582 678,858 989,440 (294,340) 1. Vertical analysis of income statement 2. Vertical analysis of the balance sheet 3. Horizontal analysis of the income statement (comparing 2003 with 2002) 4. Trend analysis of the income statement using 2001 as the base to compare the rest of the years 5. Ratio analysis showing Caltron's performance for all the industry average provided in the case. The ratio should be for years 2001, 2002 and 2003
Step by Step Solution
There are 3 Steps involved in it

Get step-by-step solutions from verified subject matter experts