

Question: CAMPBELL SOUP COMPANY Consolidated Balance Sheets (millions, except per share amounts) July 30, 2017 July 31, 2016 $ 296 626 940 46 1,908 319 605
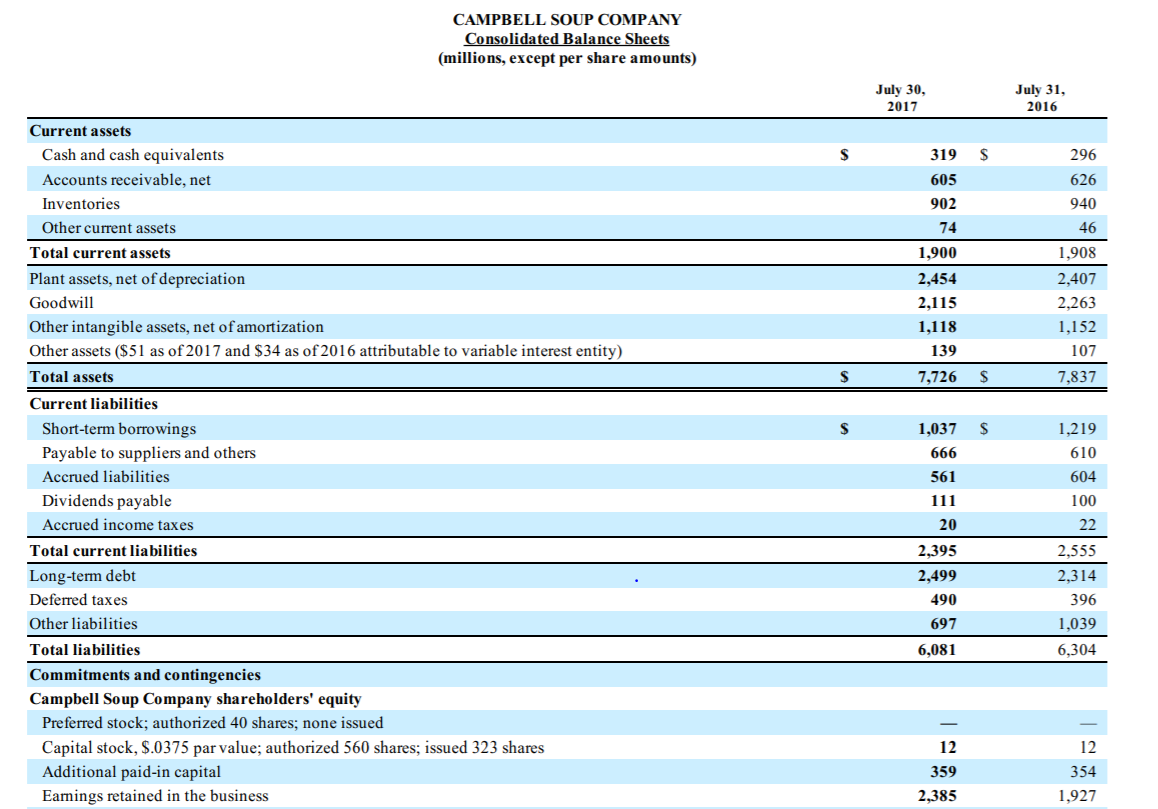
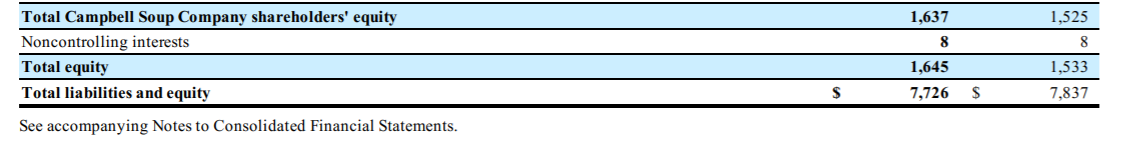

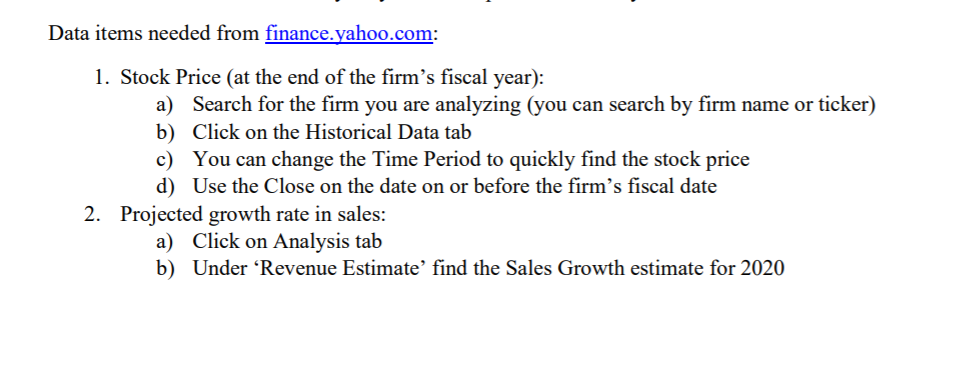
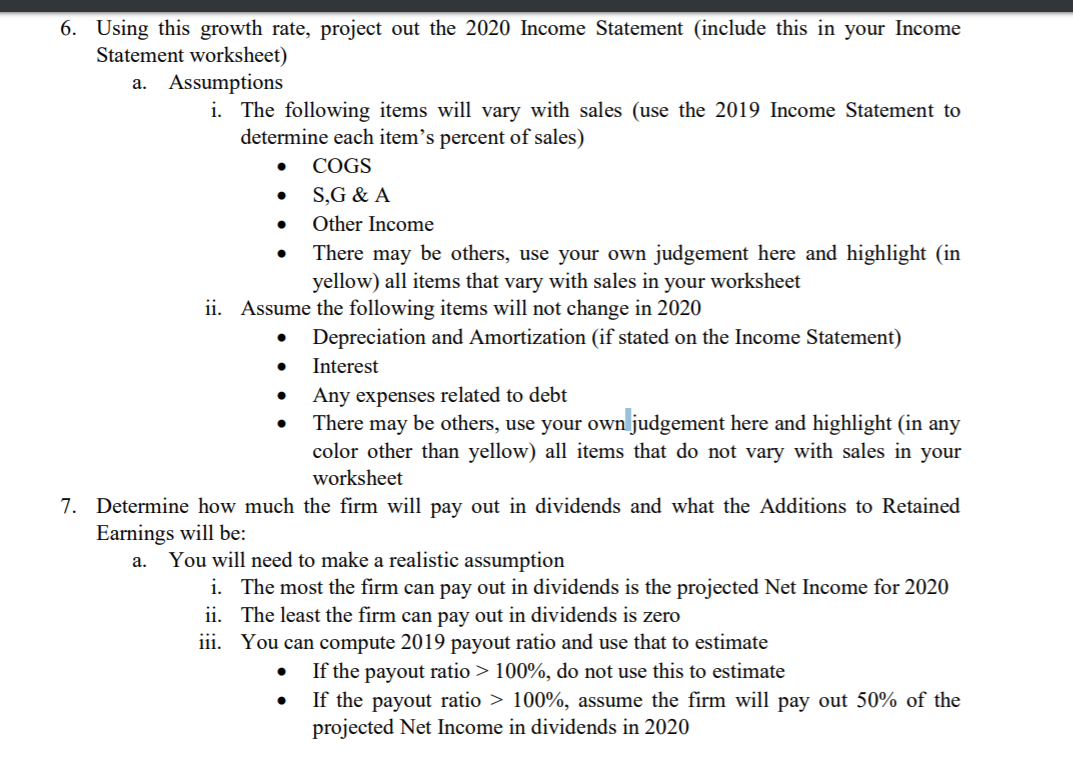
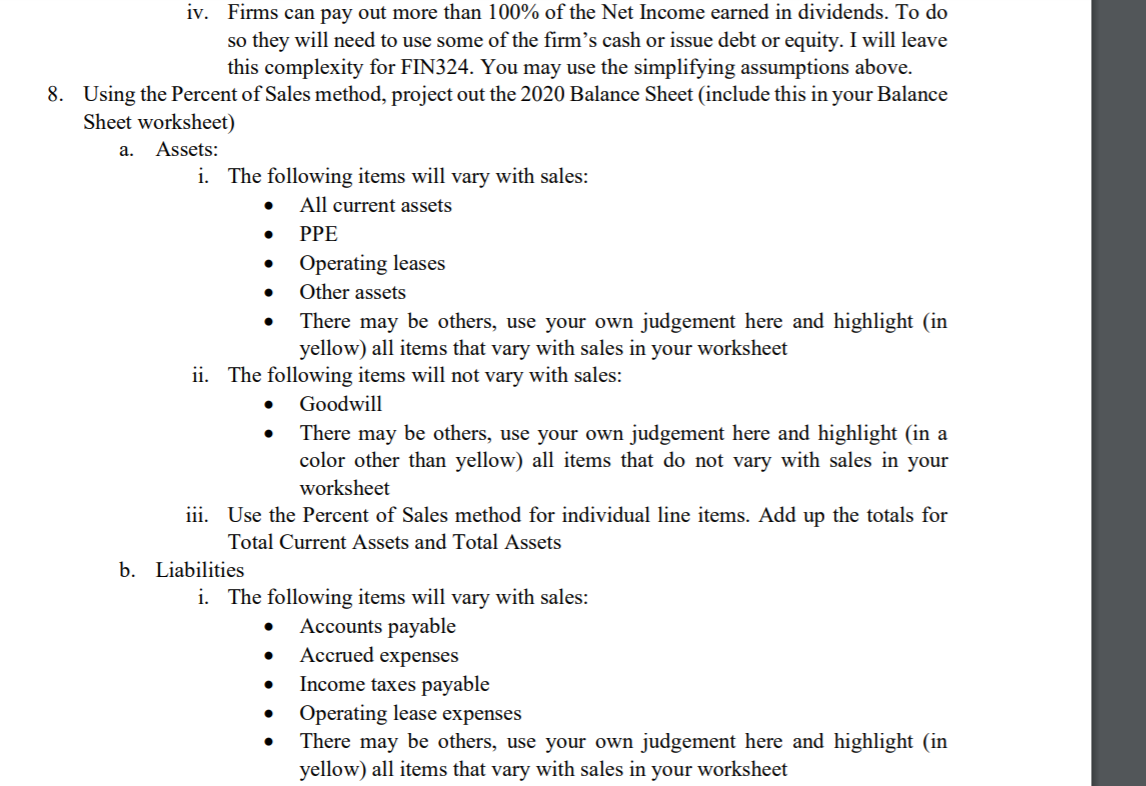
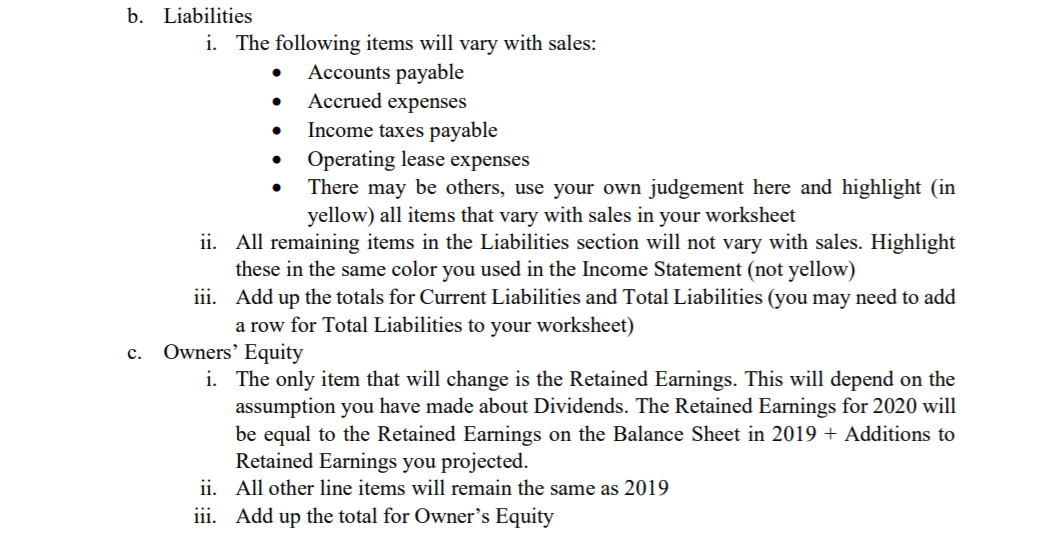

CAMPBELL SOUP COMPANY Consolidated Balance Sheets (millions, except per share amounts) July 30, 2017 July 31, 2016 $ 296 626 940 46 1,908 319 605 902 - 74 1,900 2,454 2,115 1,118 139 7,726 2,407 2,263 1,152 107 7.837 $ $ $ Current assets Cash and cash equivalents Accounts receivable, net Inventories Other current assets Total current assets Plant assets, net of depreciation Goodwill Other intangible assets, net of amortization Other assets ($51 as of 2017 and $34 as of 2016 attributable to variable interest entity) Total assets Current liabilities Short-term borrowings Payable to suppliers and others Accrued liabilities Dividends payable Accrued income taxes Total current liabilities Long-term debt Deferred taxes Other liabilities Total liabilities Commitments and contingencies Campbell Soup Company shareholders' equity Preferred stock; authorized 40 shares; none issued Capital stock, $.0375 par value; authorized 560 shares; issued 323 shares Additional paid-in capital Eamings retained in the business 1,037 666 561 111 20 1,219 610 604 100 22 2,555 2,314 396 1,039 6,304 2,395 2,499 490 697 6,081 12 359 12 354 1.927 2,385 1,637 Total Campbell Soup Company shareholders' equity Noncontrolling interests Total equity Total liabilities and equity 1,525 8 1,533 7,837 1,645 7,726 $ $ See accompanying Notes to Consolidated Financial Statements. 5. Using finance.yahoo.com, find the expected growth rate in sales for your firm a. See below for more details Data items needed from finance.yahoo.com: 1. Stock Price (at the end of the firm's fiscal year): a) Search for the firm you are analyzing (you can search by firm name or ticker) b) Click on the Historical Data tab c) You can change the Time Period to quickly find the stock price d) Use the Close on the date on or before the firm's fiscal date 2. Projected growth rate in sales: a) Click on Analysis tab b) Under Revenue Estimate' find the Sales Growth estimate for 2020 6. Using this growth rate, project out the 2020 Income Statement include this in your Income Statement worksheet) a. Assumptions i. The following items will vary with sales (use the 2019 Income Statement to determine each item's percent of sales) COGS S,G & A Other Income There may be others, use your own judgement here and highlight (in yellow) all items that vary with sales in your worksheet ii. Assume the following items will not change in 2020 Depreciation and Amortization (if stated on the Income Statement) Interest Any expenses related to debt There may be others, use your own judgement here and highlight (in any color other than yellow) all items that do not vary with sales in your worksheet 7. Determine how much the firm will pay out in dividends and what the Additions to Retained Earnings will be: a. You will need to make a realistic assumption i. The most the firm can pay out in dividends is the projected Net Income for 2020 ii. The least the firm can pay out in dividends is zero iii. You can compute 2019 payout ratio and use that to estimate If the payout ratio > 100%, do not use this to estimate If the payout ratio > 100%, assume the firm will pay out 50% of the projected Net Income in dividends in 2020 iv. Firms can pay out more than 100% of the Net Income earned in dividends. To do so they will need to use some of the firm's cash or issue debt or equity. I will leave this complexity for FIN324. You may use the simplifying assumptions above. 8. Using the Percent of Sales method, project out the 2020 Balance Sheet (include this in your Balance Sheet worksheet) a. Assets: i. The following items will vary with sales: All current assets PPE Operating leases Other assets There may be others, use your own judgement here and highlight (in yellow) all items that vary with sales in your worksheet ii. The following items will not vary with sales: Goodwill There may be others, use your own judgement here and highlight (in a color other than yellow) all items that do not vary with sales in your worksheet iii. Use the Percent of Sales method for individual line items. Add up the totals for Total Current Assets and Total Assets b. Liabilities i. The following items will vary with sales: Accounts payable Accrued expenses Income taxes payable Operating lease expenses There may be others, use your own judgement here and highlight (in yellow) all items that vary with sales in your worksheet b. Liabilities i. The following items will vary with sales: Accounts payable Accrued expenses Income taxes payable Operating lease expenses There may be others, use your own judgement here and highlight (in yellow) all items that vary with sales in your worksheet ii. All remaining items in the Liabilities section will not vary with sales. Highlight these in the same color you used in the Income Statement (not yellow) iii. Add up the totals for Current Liabilities and Total Liabilities (you may need to add a row for Total Liabilities to your worksheet) c. Owners' Equity i. The only item that will change is the Retained Earnings. This will depend on the assumption you have made about Dividends. The Retained Earnings for 2020 will be equal to the Retained Earnings on the Balance Sheet in 2019 + Additions to Retained Earnings you projected. ii. All other line items will remain the same as 2019 iii. Add up the total for Owner's Equity ected 9. Based on your projections, what is the firm's External Financing Needed? What recommendations do you have for the firm to meet these needs? List three (3) ways the firms can balance the projected 2020 Balance Sheet. CAMPBELL SOUP COMPANY Consolidated Balance Sheets (millions, except per share amounts) July 30, 2017 July 31, 2016 $ 296 626 940 46 1,908 319 605 902 - 74 1,900 2,454 2,115 1,118 139 7,726 2,407 2,263 1,152 107 7.837 $ $ $ Current assets Cash and cash equivalents Accounts receivable, net Inventories Other current assets Total current assets Plant assets, net of depreciation Goodwill Other intangible assets, net of amortization Other assets ($51 as of 2017 and $34 as of 2016 attributable to variable interest entity) Total assets Current liabilities Short-term borrowings Payable to suppliers and others Accrued liabilities Dividends payable Accrued income taxes Total current liabilities Long-term debt Deferred taxes Other liabilities Total liabilities Commitments and contingencies Campbell Soup Company shareholders' equity Preferred stock; authorized 40 shares; none issued Capital stock, $.0375 par value; authorized 560 shares; issued 323 shares Additional paid-in capital Eamings retained in the business 1,037 666 561 111 20 1,219 610 604 100 22 2,555 2,314 396 1,039 6,304 2,395 2,499 490 697 6,081 12 359 12 354 1.927 2,385 1,637 Total Campbell Soup Company shareholders' equity Noncontrolling interests Total equity Total liabilities and equity 1,525 8 1,533 7,837 1,645 7,726 $ $ See accompanying Notes to Consolidated Financial Statements. 5. Using finance.yahoo.com, find the expected growth rate in sales for your firm a. See below for more details Data items needed from finance.yahoo.com: 1. Stock Price (at the end of the firm's fiscal year): a) Search for the firm you are analyzing (you can search by firm name or ticker) b) Click on the Historical Data tab c) You can change the Time Period to quickly find the stock price d) Use the Close on the date on or before the firm's fiscal date 2. Projected growth rate in sales: a) Click on Analysis tab b) Under Revenue Estimate' find the Sales Growth estimate for 2020 6. Using this growth rate, project out the 2020 Income Statement include this in your Income Statement worksheet) a. Assumptions i. The following items will vary with sales (use the 2019 Income Statement to determine each item's percent of sales) COGS S,G & A Other Income There may be others, use your own judgement here and highlight (in yellow) all items that vary with sales in your worksheet ii. Assume the following items will not change in 2020 Depreciation and Amortization (if stated on the Income Statement) Interest Any expenses related to debt There may be others, use your own judgement here and highlight (in any color other than yellow) all items that do not vary with sales in your worksheet 7. Determine how much the firm will pay out in dividends and what the Additions to Retained Earnings will be: a. You will need to make a realistic assumption i. The most the firm can pay out in dividends is the projected Net Income for 2020 ii. The least the firm can pay out in dividends is zero iii. You can compute 2019 payout ratio and use that to estimate If the payout ratio > 100%, do not use this to estimate If the payout ratio > 100%, assume the firm will pay out 50% of the projected Net Income in dividends in 2020 iv. Firms can pay out more than 100% of the Net Income earned in dividends. To do so they will need to use some of the firm's cash or issue debt or equity. I will leave this complexity for FIN324. You may use the simplifying assumptions above. 8. Using the Percent of Sales method, project out the 2020 Balance Sheet (include this in your Balance Sheet worksheet) a. Assets: i. The following items will vary with sales: All current assets PPE Operating leases Other assets There may be others, use your own judgement here and highlight (in yellow) all items that vary with sales in your worksheet ii. The following items will not vary with sales: Goodwill There may be others, use your own judgement here and highlight (in a color other than yellow) all items that do not vary with sales in your worksheet iii. Use the Percent of Sales method for individual line items. Add up the totals for Total Current Assets and Total Assets b. Liabilities i. The following items will vary with sales: Accounts payable Accrued expenses Income taxes payable Operating lease expenses There may be others, use your own judgement here and highlight (in yellow) all items that vary with sales in your worksheet b. Liabilities i. The following items will vary with sales: Accounts payable Accrued expenses Income taxes payable Operating lease expenses There may be others, use your own judgement here and highlight (in yellow) all items that vary with sales in your worksheet ii. All remaining items in the Liabilities section will not vary with sales. Highlight these in the same color you used in the Income Statement (not yellow) iii. Add up the totals for Current Liabilities and Total Liabilities (you may need to add a row for Total Liabilities to your worksheet) c. Owners' Equity i. The only item that will change is the Retained Earnings. This will depend on the assumption you have made about Dividends. The Retained Earnings for 2020 will be equal to the Retained Earnings on the Balance Sheet in 2019 + Additions to Retained Earnings you projected. ii. All other line items will remain the same as 2019 iii. Add up the total for Owner's Equity ected 9. Based on your projections, what is the firm's External Financing Needed? What recommendations do you have for the firm to meet these needs? List three (3) ways the firms can balance the projected 2020 Balance Sheet
Step by Step Solution
There are 3 Steps involved in it

Get step-by-step solutions from verified subject matter experts