

Question: Can any expert help me with this using Matlab, please? Hi expert! For the cvs file to imported, you can just ignore and just provide
 Can any expert help me with this using Matlab, please?
Hi expert! For the cvs file to imported, you can just ignore and just provide me the code. I guess I cannot upload the cvs file here
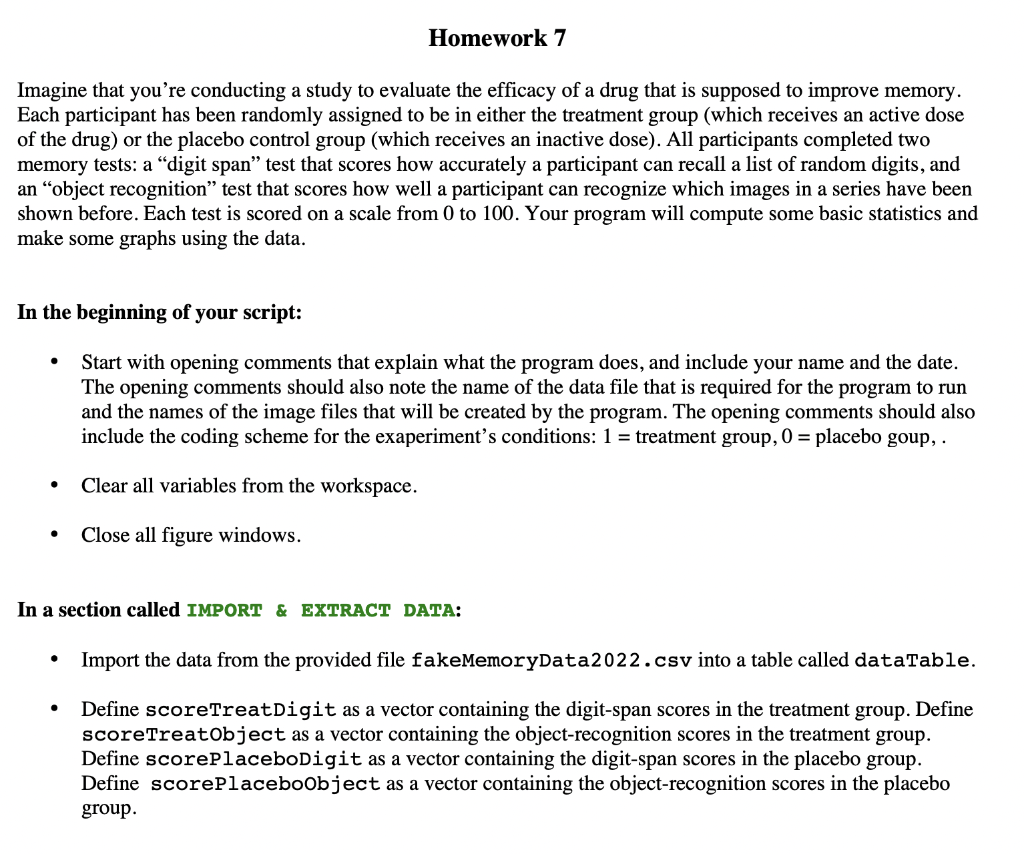
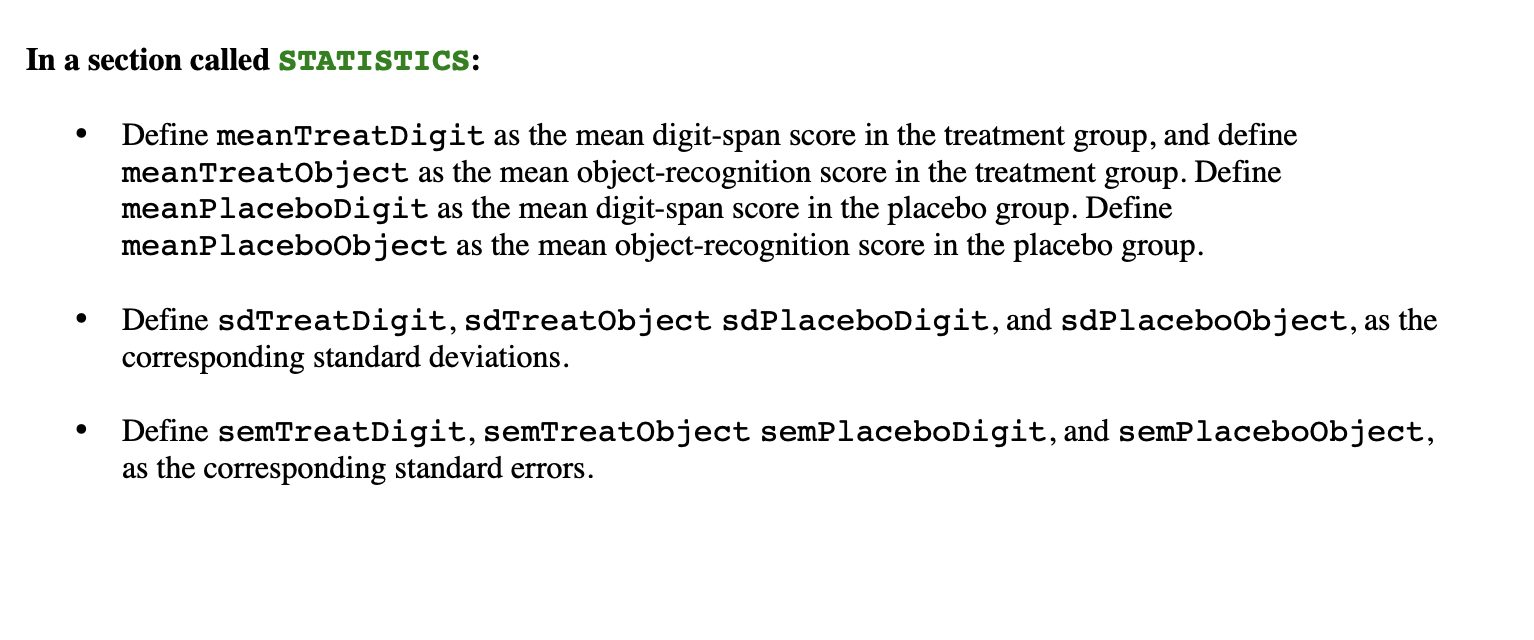
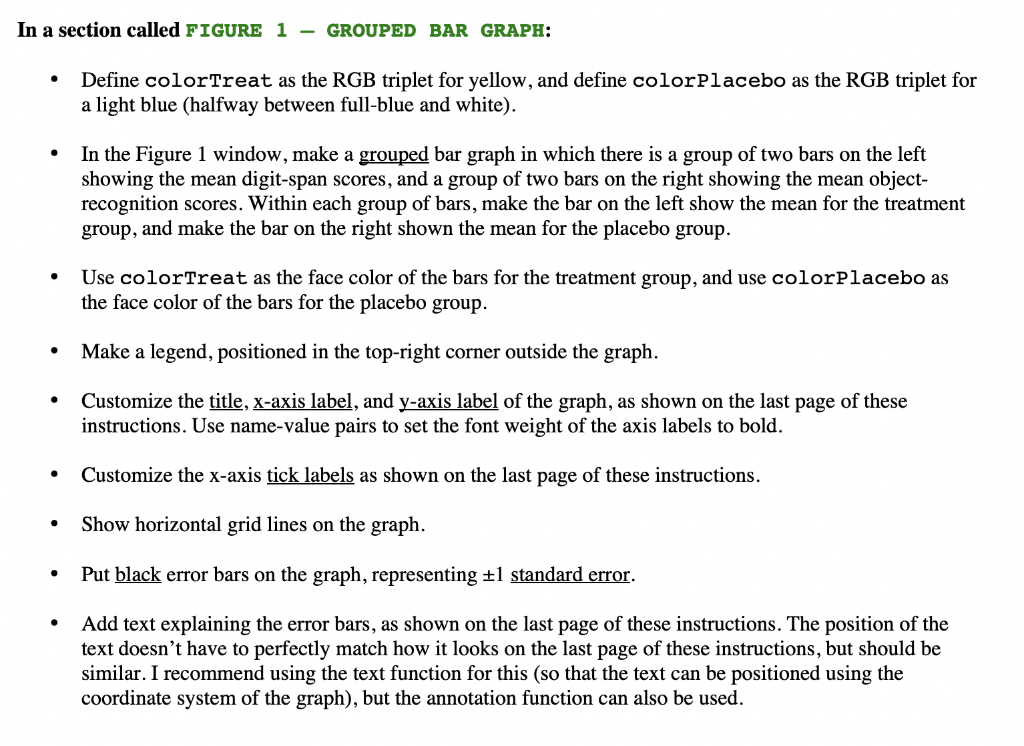
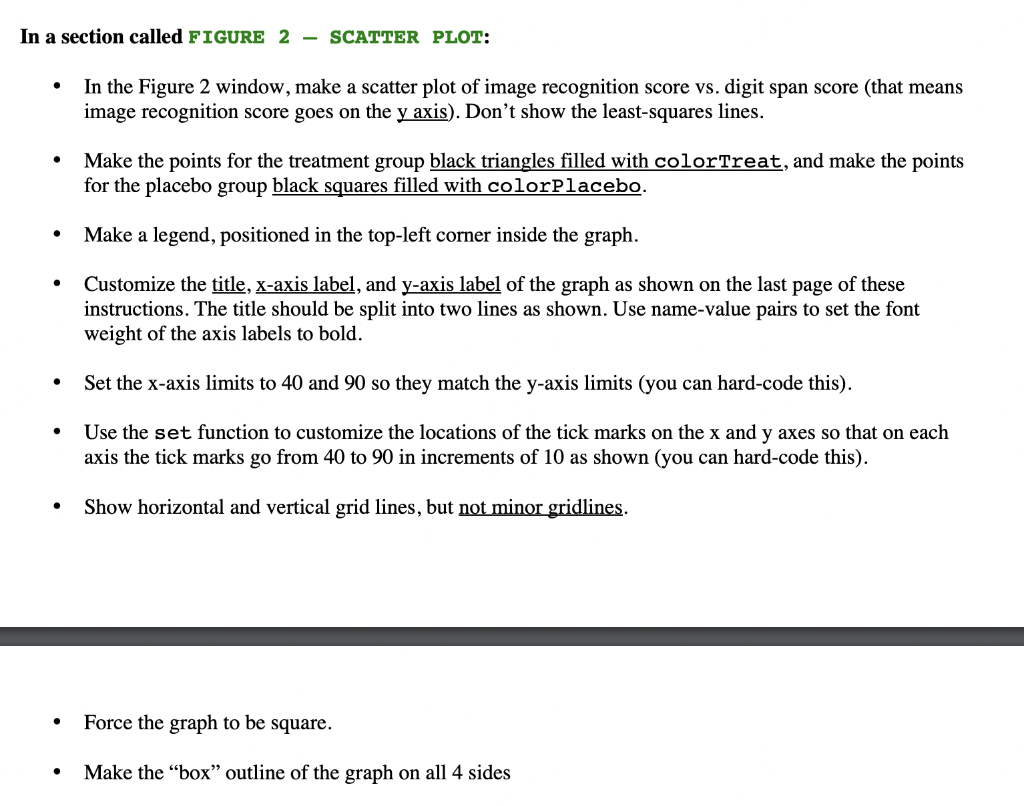
Imagine that you're conducting a study to evaluate the efficacy of a drug that is supposed to improve memory. Each participant has been randomly assigned to be in either the treatment group (which receives an active dose of the drug) or the placebo control group (which receives an inactive dose). All participants completed two memory tests: a "digit span" test that scores how accurately a participant can recall a list of random digits, and an "object recognition" test that scores how well a participant can recognize which images in a series have been shown before. Each test is scored on a scale from 0 to 100 . Your program will compute some basic statistics and make some graphs using the data. In the beginning of your script: - Start with opening comments that explain what the program does, and include your name and the date. The opening comments should also note the name of the data file that is required for the program to run and the names of the image files that will be created by the program. The opening comments should also include the coding scheme for the exaperiment's conditions: 1= treatment group, 0= placebo goup, . - Clear all variables from the workspace. - Close all figure windows. In a section called IMPORT \& EXTRACT DATA: - Import the data from the provided file fakememoryData2022 . csv into a table called dataTable. - Define scoreTreatDigit as a vector containing the digit-span scores in the treatment group. Define scoreTreatObject as a vector containing the object-recognition scores in the treatment group. Define scorePlaceboDigit as a vector containing the digit-span scores in the placebo group. Define scorePlaceboobject as a vector containing the object-recognition scores in the placebo group. In a section called STATISTICS: - Define meantreatDigit as the mean digit-span score in the treatment group, and define meanTreatobject as the mean object-recognition score in the treatment group. Define meanPlaceboDigit as the mean digit-span score in the placebo group. Define meanPlaceboobject as the mean object-recognition score in the placebo group. - Define sdTreatDigit, sdTreatObject sdPlaceboDigit, and sdPlaceboobject, as the corresponding standard deviations. - Define semTreatDigit, semTreatobject semPlaceboDigit, and semPlaceboobject, as the corresponding standard errors. n a section called FIGURE 1 - GROUPED BAR GRAPH: - Define colorTreat as the RGB triplet for yellow, and define colorPl acebo as the RGB triplet fo a light blue (halfway between full-blue and white). - In the Figure 1 window, make a grouped bar graph in which there is a group of two bars on the left showing the mean digit-span scores, and a group of two bars on the right showing the mean objectrecognition scores. Within each group of bars, make the bar on the left show the mean for the treatment group, and make the bar on the right shown the mean for the placebo group. - Use colortreat as the face color of the bars for the treatment group, and use colorplacebo as the face color of the bars for the placebo group. - Make a legend, positioned in the top-right corner outside the graph. - Customize the title, x-axis label, and y-axis label of the graph, as shown on the last page of these instructions. Use name-value pairs to set the font weight of the axis labels to bold. - Customize the x-axis tick labels as shown on the last page of these instructions. - Show horizontal grid lines on the graph. - Put black error bars on the graph, representing 1 standard error. - Add text explaining the error bars, as shown on the last page of these instructions. The position of the text doesn't have to perfectly match how it looks on the last page of these instructions, but should be similar. I recommend using the text function for this (so that the text can be positioned using the coordinate system of the graph), but the annotation function can also be used. In a section called FIGURE 2 - SCATTER PLOT: - In the Figure 2 window, make a scatter plot of image recognition score vs. digit span score (that means image recognition score goes on the y axis). Don't show the least-squares lines. - Make the points for the treatment group black triangles filled with colorTreat, and make the points for the placebo group black squares filled with colorplacebo. - Make a legend, positioned in the top-left corner inside the graph. - Customize the title, x-axis label, and y-axis label of the graph as shown on the last page of these instructions. The title should be split into two lines as shown. Use name-value pairs to set the font weight of the axis labels to bold. - Set the x-axis limits to 40 and 90 so they match the y-axis limits (you can hard-code this). - Use the set function to customize the locations of the tick marks on the x and y axes so that on each axis the tick marks go from 40 to 90 in increments of 10 as shown (you can hard-code this). - Show horizontal and vertical grid lines, but not minor gridlines. - Force the graph to be square. - Make the "box" outline of the graph on all 4 sides In a section called SAVE FIGURES: - Save the contents of Figures 1 and 2, respectively, to files called psych20ahw 7fig1pdf and psych20ahw7fig2.pdf IMPORTANT: Be sure to check your graphs against the data to verify that they're correct before submitting your homework. For example, the value of meantreatobject should match the height of the corresponding bar in the Figure 1 graph
Step by Step Solution
There are 3 Steps involved in it

Get step-by-step solutions from verified subject matter experts