

Question: Lagrange Interpolation Problem So I have to write an lagrange function in matlab and demonstrate that the function works by interpolating the function sin(2x) on
Lagrange Interpolation Problem
So I have to write an lagrange function in matlab and demonstrate that the function works by interpolating the function sin(2x) on the domain x [0, 1]. The template teacher provides looks very similar like the one on the Matlab forum, but I have no idea how to implementing this:
function y=lagrange(x,pointx,pointy) % %LAGRANGE approx a point-defined function using the Lagrange polynomial interpolation % % LAGRANGE(X,POINTX,POINTY) approx the function definited by the points: % P1=(POINTX(1),POINTY(1)), P2=(POINTX(2),POINTY(2)), ..., PN(POINTX(N),POINTY(N)) % and calculate it in each elements of X % % If POINTX and POINTY have different number of elements the function will return the NaN value % % function wrote by: Calzino % 7-oct-2001 % n=size(pointx,2); L=ones(n,size(x,2)); if (size(pointx,2)~=size(pointy,2)) fprintf(1,' ERROR! POINTX and POINTY must have the same number of elements '); y=NaN; else for i=1:n for j=1:n if (i~=j) L(i,:)=L(i,:).*(x-pointx(j))/(pointx(i)-pointx(j)); end end end y=0; for i=1:n y=y+pointy(i)*L(i,:); end end
I try to do
fx = sin(2*pi*x); x = linspace(0,1,5); interp = linspace(0,1); yy = lagrange_template(interp,fx,x); plot(interp,yy,'-k')
on a new separate file. But the graph is empty. Can someone teach me how to actually implementing this m file please. and helps me with the absolute error at x = 1/9, Thank you very much !!! This question in detail can be find below
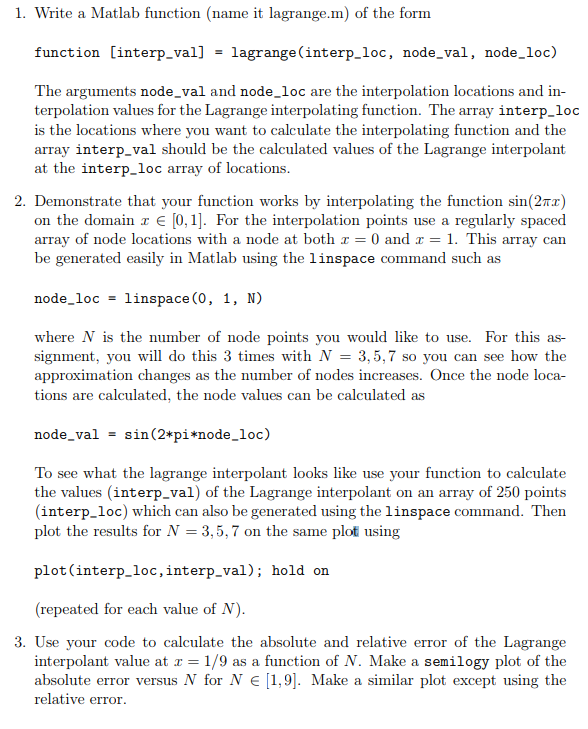
1. Write a Matlab function (name it lagrange.m) of the form function [interp_val] - lagrange(interp_loc, node_val, node_loc) The arguments node_val and node_loc are the interpolation locations andin terpolation values for the Lagrange interpolating function. The array interp_loc is the locations where you want to calculate the interpolating function and the array interp_val should be the calculated values of the Lagrange interpolant at the interp_loc array of locations 2. Demonstrate that your function works by interpolating the function sin(2Tr) on the domain r E [0,1. For the interpolation points use a regularly spaced array of node locations with a be generated easily in Matlab using the linspace command such as node at both 1 0 and x = 1. This array can node_loc-linspace (0, 1, N) where N is the number of node points you would like to use. For this as- signment, you will do this 3 times with N-3,5,7 so you can see how the approximation changes as the number of nodes increases. Once the node loca- tions are calculated, the node values can be calculated as node_valsin (2*pi*node_loc) To see what the lagrange interpolant looks like use your function to calculate the values (interp_val) of the Lagrange interpolant on an array of 250 points (interp_loc) which can also be generated using the linspace command. Then plot the results for N 3,5,7 on the same plot using plot(interp_loc,interp_val); hold on (repeated for each value of N) 3. Use your code to calculate the absolute and relative error of the Lagrange interpolant value at x = 1/9 as a function of N. Make a semi logy plot of the absolute error versus N for N E1,9. Make a similar plot except using the relative error
Step by Step Solution
There are 3 Steps involved in it

Get step-by-step solutions from verified subject matter experts