

Question: Can anyone assist with this question below, step by step answers please as I am studying for a final exam, thank you! The following data
Can anyone assist with this question below, step by step answers please as I am studying for a final exam, thank you!
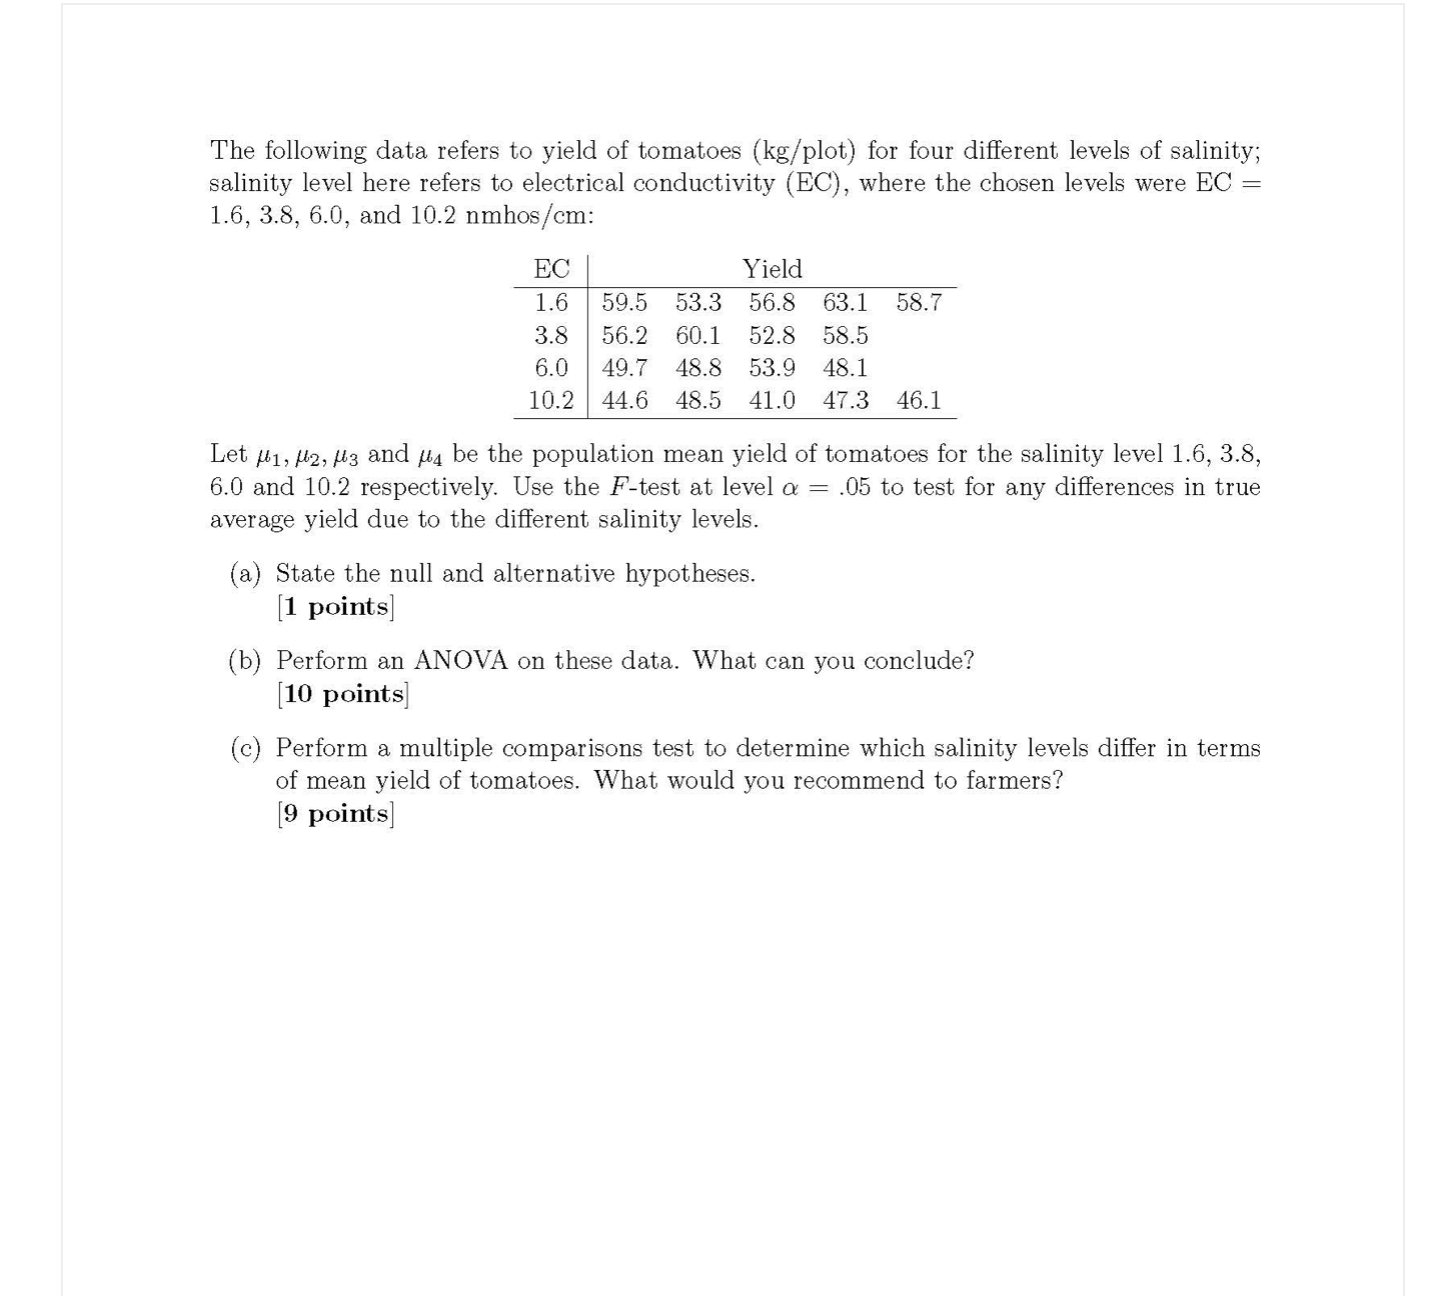
The following data refers to yield of tomatoes (kg/ plot) for four different levels of salinity; salinity level here refers to electrical conductivity (EC), where the chosen levels were EC : 1.6, 3.8, 6.0, and 10.2 nmhos/cm: EC Yield 1.6 59.5 53.3 56.8 63.1 58.7 3.8 56.2 60.1 52.8 58.5 6.0 49.7 48.8 53.9 48.1 10.2 44.6 48.5 41.0 47.3 46.1 Let a1, #2, p3 and #4 be the population mean yield of tomatoes for the salinity level 1.6, 3.8, 6.0 and 10.2 respectively. Use the F-test at level a: = .05 to test for any dierences in true average yield due to the different salinity levels. (a) State the null and alternative hypotheses. [1 points] (b) Perform an ANOVA on these data. What can you conclude? [10 points] (C) Perform a multiple comparisons test to determine which salinity levels dier in terms of mean yield of tomatoes. What would you recommend to farmers? [9 points]
Step by Step Solution
There are 3 Steps involved in it

Get step-by-step solutions from verified subject matter experts