

Question: Can anyone explain why answer is D? QMS 442 question in chapter 4 Q7: The simple linear regression printout relating slays price (y) to appraised
Can anyone explain why answer is D? QMS 442 question in chapter 4
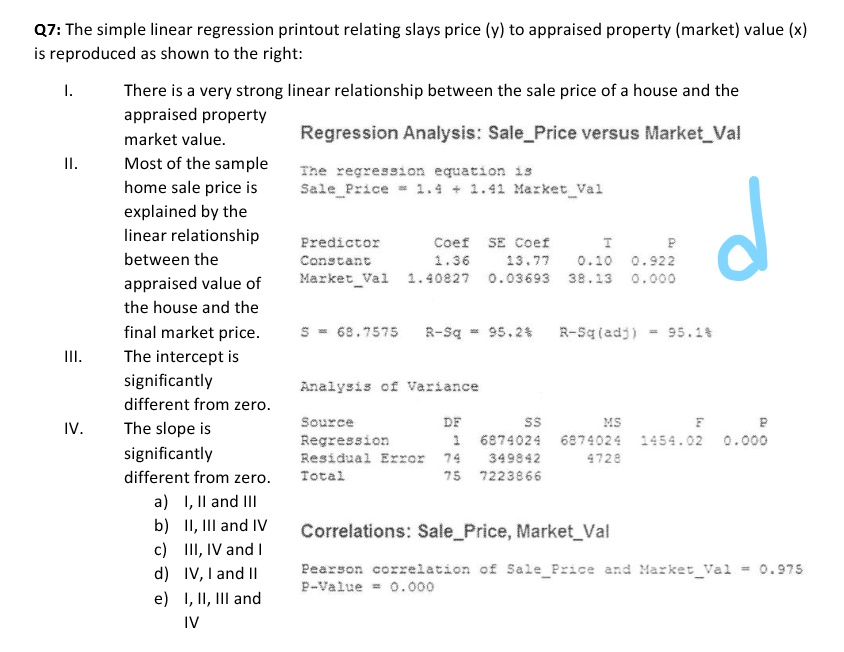
Q7: The simple linear regression printout relating slays price (y) to appraised property (market) value (x) is reproduced as shown to the right: There is a very strong linear relationship between the sale price of a house and the appraised property market value. Regression Analysis: Sale_Price versus Market_Val II. Most of the sample The regression equation is home sale price is Sale Price = 1. 4 + 1. 41 Market Val explained by the linear relationship Predictor Coef SE Coef T P O between the Constant 1.36 13.77 0.10 0. 922 appraised value of Market Val 1. 40827 0. 03693 38. 13 3 0.000 the house and the final market price. S = 68 . 7575 R-Sq = 95.2% R-5q(adj) = 95 .14 III. The intercept is significantly Analysis of Variance different from zero. Source DF SS E IV. The slope is MS Regression T significantly 6874024 6874024 1454 . 02 0.000 Residual Error 74 349842 4728 different from zero. Total 75 7223866 a) I, ll and III b) ll, Ill and IV c) Ill, IV and I Correlations: Sale_Price, Market_Val d) IV, I and II Pearson correlation of Sale_Price and Market_Val = 0.975 e) I, II, Ill and P-Value = 0.000 IV
Step by Step Solution
There are 3 Steps involved in it

Get step-by-step solutions from verified subject matter experts