

Question: Can anyone help me on these problems? 23.) From March 2020-Sept 2020, both US output growth and European output growth fell. If the US ination
Can anyone help me on these problems?
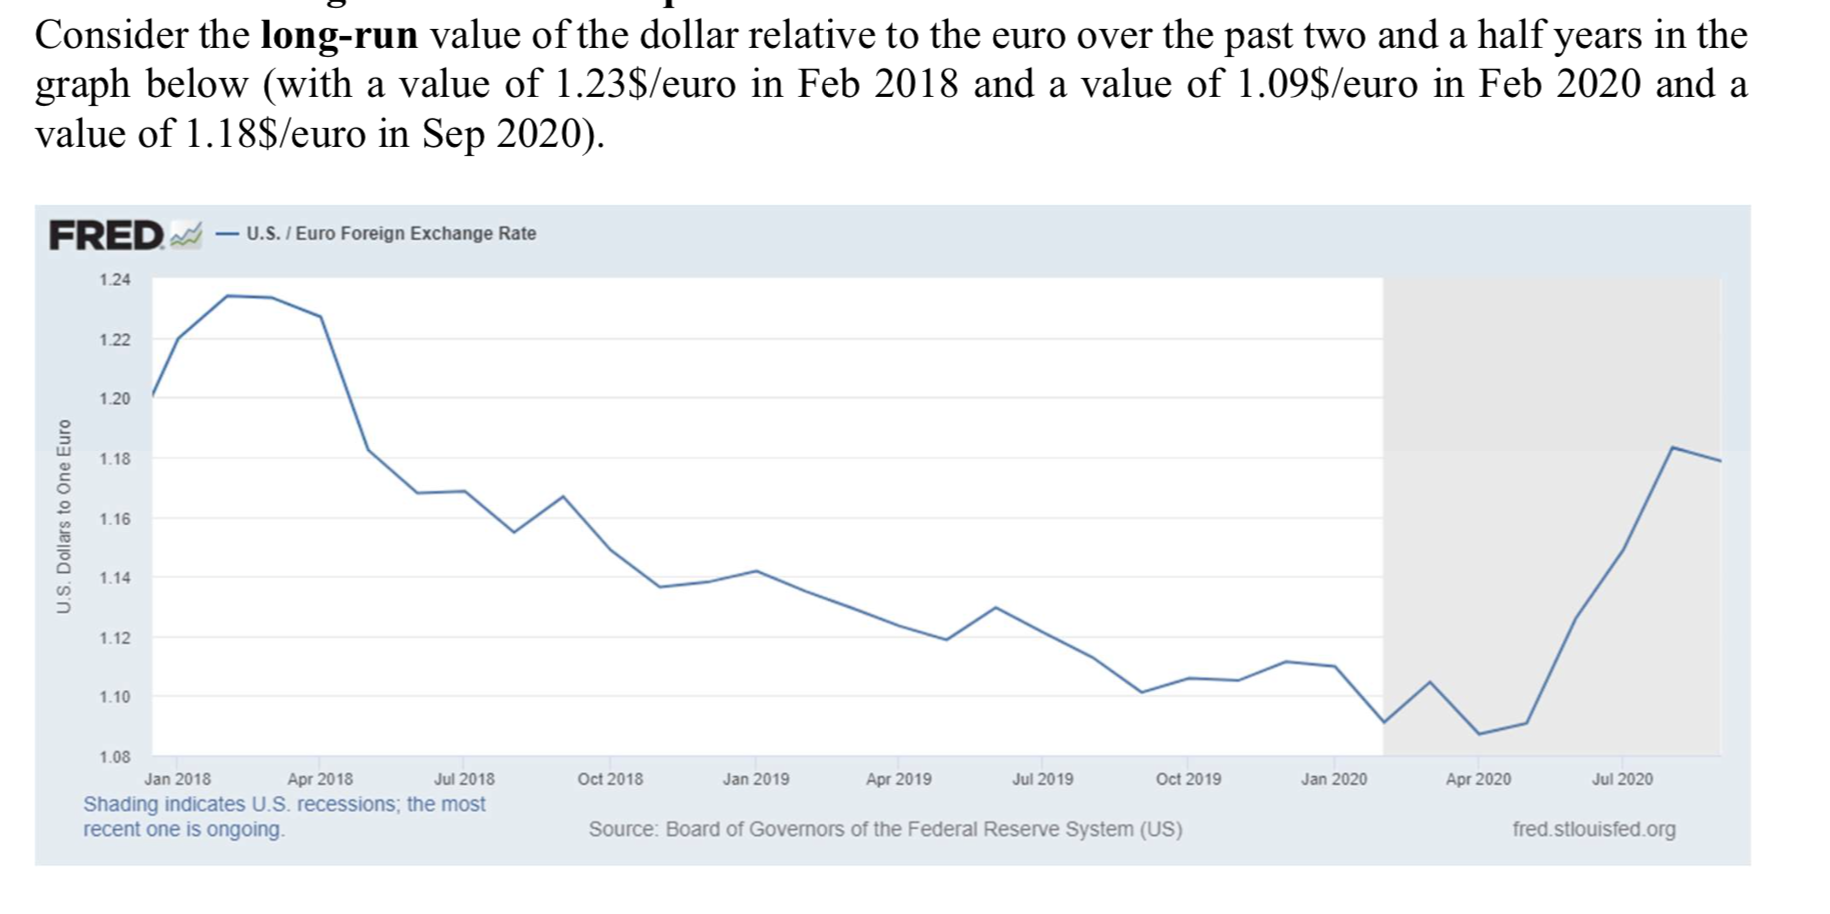
23.) From March 2020-Sept 2020, both US output growth and European output growth fell. If the US ination rate was 1.4% and the European ination rate was 0.62% over this period, can the long-run monetary approach to the exchange rate explain this period in the graph? 24.) Suppose that in response to the large downturns in output growth since March 2020, the US increases its money supply growth more than the EU increases its money supply growth over the next year. Holding other variables the same, what is the expected impact on the ination rate in the US. and the expected rate of depreciation (or appreciation) in the US. $ relative to the euro over the next year? Explain why. Consider the long-run value of the dollar relative to the euro over the past two and a half years in the graph below (with a value of 1.23$/euro in Feb 2018 and a value of 1.09$/euro in Feb 2020 and a value of 1.18$/euro in Sep 2020). FRED ~- U.S. / Euro Foreign Exchange Rate 1.24 1.22 1.20 U.S. Dollars to One Euro 1.18 1.16 1.14 1.12 1.10 1.08 Jan 2018 Apr 2018 Jul 2018 Oct 2018 Jan 2019 Apr 2019 Jul 2019 Oct 2019 Jan 2020 Apr 2020 Jul 2020 Shading indicates U.S. recessions; the most recent one is ongoing. Source: Board of Governors of the Federal Reserve System (US) fred. stlouisfed.org25.) If the increase in the US money supply growth in the previous question changes expectations today (i.e., we believe this increased money growth is permanent such that ination expectations change), what is the likely impact right away? (hint, consider the Fisher effect and the impact on i and E today)
Step by Step Solution
There are 3 Steps involved in it

Get step-by-step solutions from verified subject matter experts