

Question: can anyone help me to write Matlab function-file to obtain this graph? where RUL is Remaining useful life -MI M2 0.3 The actual RUL 0.2
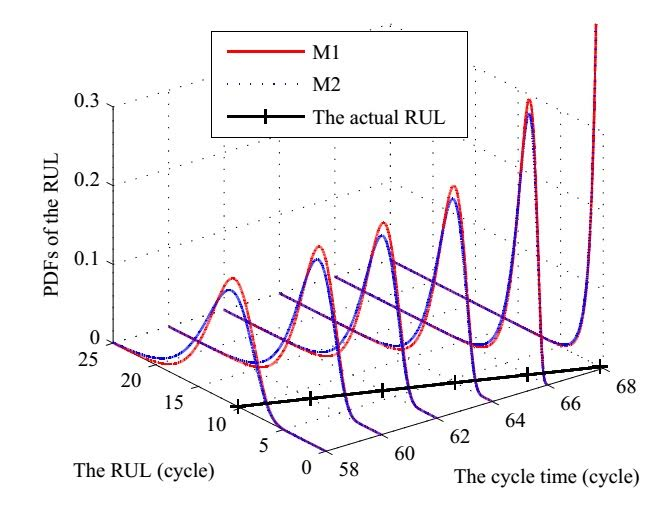 can anyone help me to write Matlab function-file to obtain this graph? where RUL is Remaining useful life
-MI M2 0.3 The actual RUL 0.2 0 25 20 68 15 10 64 62 60 The RUL (cycle) 0 58 The cycle time (cycle) -MI M2 0.3 The actual RUL 0.2 0 25 20 68 15 10 64 62 60 The RUL (cycle) 0 58 The cycle time (cycle)
Step by Step Solution
There are 3 Steps involved in it
1 Expert Approved Answer
Step: 1 Unlock

Question Has Been Solved by an Expert!
Get step-by-step solutions from verified subject matter experts
Step: 2 Unlock
Step: 3 Unlock