

Question: can anyone please help me with this question...? 1. Single Component Phase Diagram: The diagram below is a single component phase diagram for ammonia. a.
can anyone please help me with this question...? 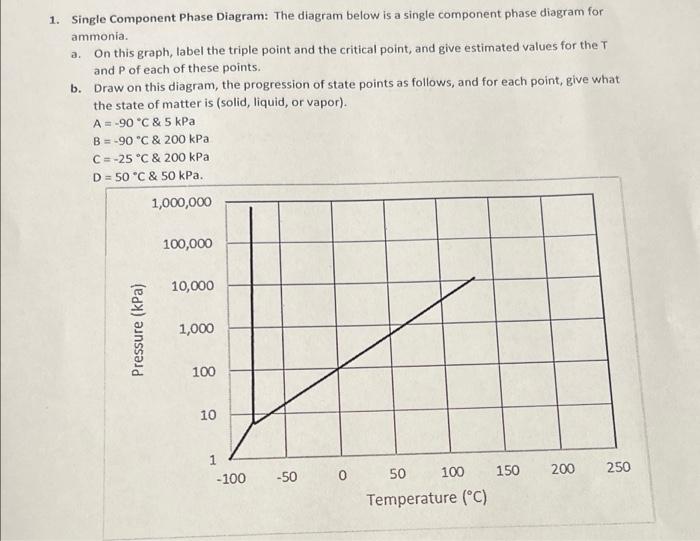
1. Single Component Phase Diagram: The diagram below is a single component phase diagram for ammonia. a. On this graph, label the triple point and the critical point, and give estimated values for the T and P of each of these points. b. Draw on this diagram, the progression of state points as follows, and for each point, give what the state of matter is (solid, liquid, or vapor). A = -90 C & 5 kPa B = -90 C & 200 kPa C = -25 C & 200 kPa D = 50*C & 50 kPa. 1,000,000 100,000 10,000 Pressure (kPa) 1,000 100 10 250 150 200 -100 -50 0 50 100 Temperature (C)
Step by Step Solution
There are 3 Steps involved in it
1 Expert Approved Answer
Step: 1 Unlock

Question Has Been Solved by an Expert!
Get step-by-step solutions from verified subject matter experts
Step: 2 Unlock
Step: 3 Unlock