

Question: Can anyone solve this question (intro to statistics) frequency distribution plz! The table below shows the frequency distribution of the weights (in grams) of pre-1964
Can anyone solve this question (intro to statistics) frequency distribution plz!
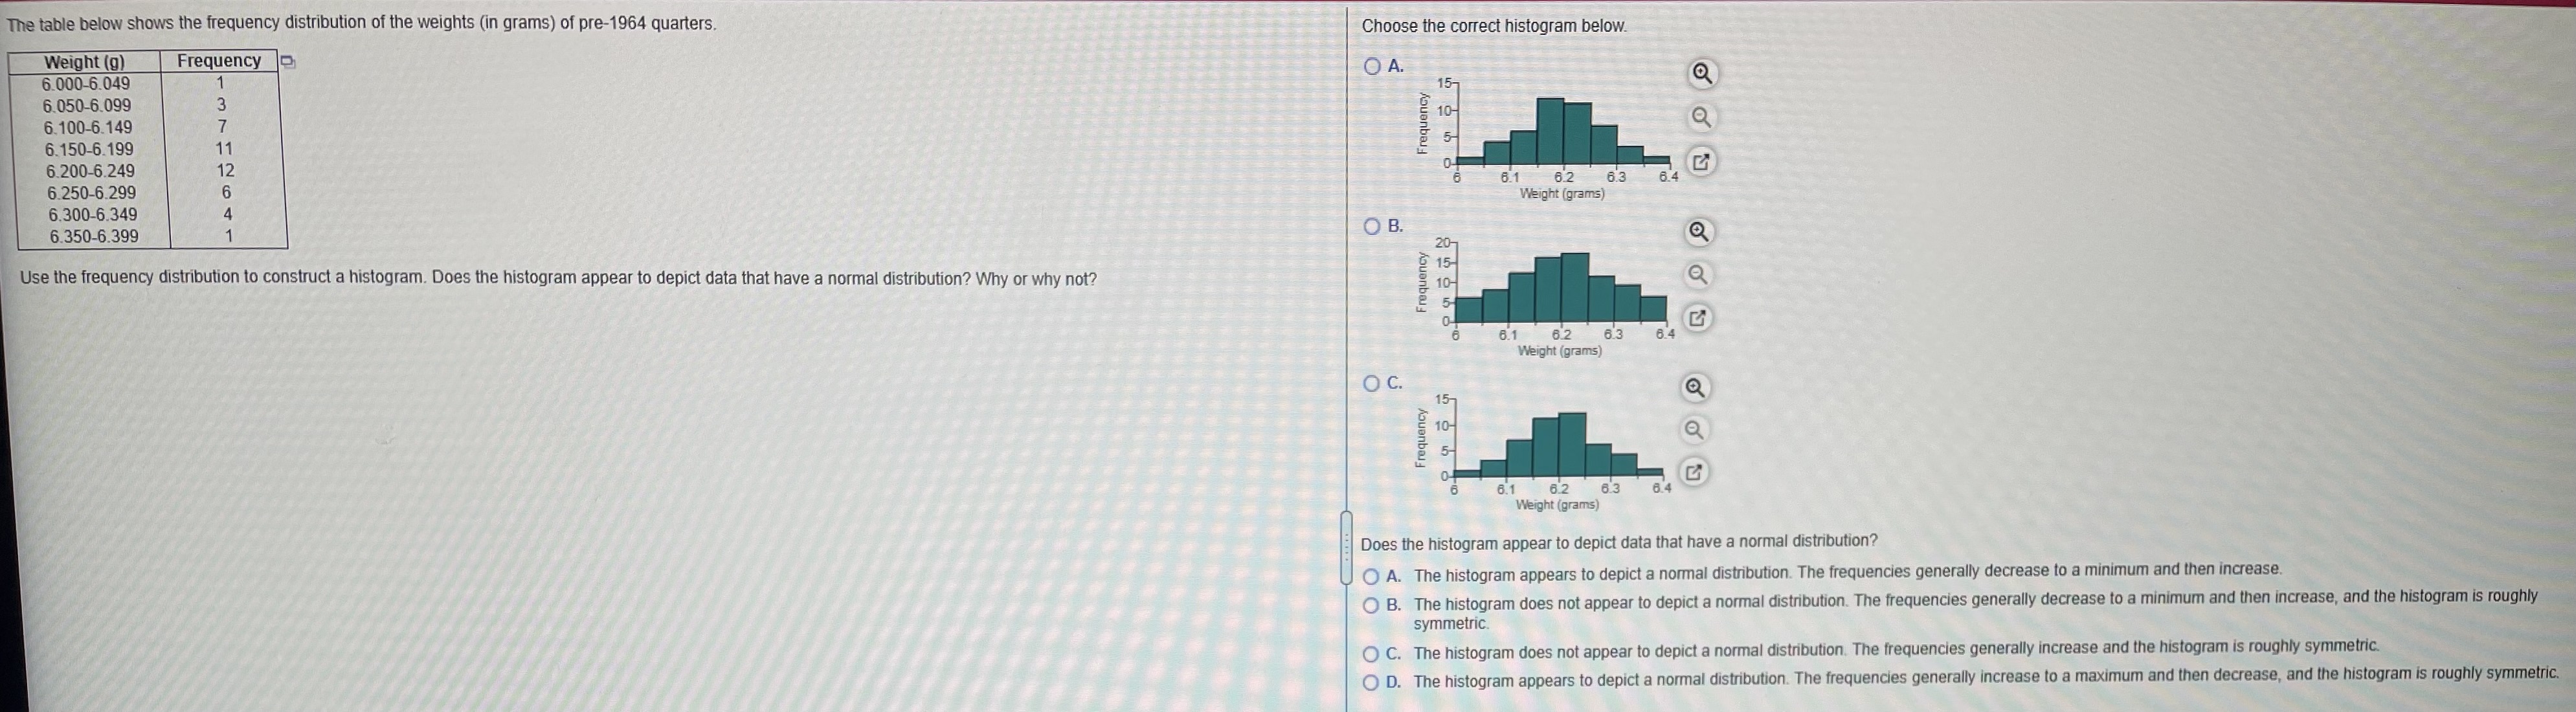
The table below shows the frequency distribution of the weights (in grams) of pre-1964 quarters. Choose the correct histogram below. Weight (9) Frequency 6.000-6.049 O A. 6.050-6.099 6.100-6.149 Frequency 6.150-6.199 6.200-6.249 6.250-6.299 6.1 6.2 63 64 6.300-6.349 Weight (grams) 6.350-6.399 O B. Use the frequency distribution to construct a histogram. Does the histogram appear to depict data that have a normal distribution? Why or why not? Frequency 3.1 63 6.4 Weight (grams) O C. Frequency 6.1 6.2 6.4 Weight (grams) Does the histogram appear to depict data that have a normal distribution? O A. The histogram appears to depict a normal distribution. The frequencies generally decrease to a minimum and then increase. O B. The histogram does not appear to depict a normal distribution. The frequencies generally decrease to a minimum and then increase, and the histogram is roughly symmetric. O C. The histogram does not appear to depict a normal distribution. The frequencies generally increase and the histogram is roughly symmetric. O D. The histogram appears to depict a normal distribution. The frequencies generally increase to a maximum and then decrease, and the histogram is roughly symmetric
Step by Step Solution
There are 3 Steps involved in it

Get step-by-step solutions from verified subject matter experts