

Question: Can anyone solve this question? The table is below. Question 3 Ta e2 e ow istsmont yexcess returnsont eB ac roc iS aresTIPS Bon ETF
Can anyone solve this question?
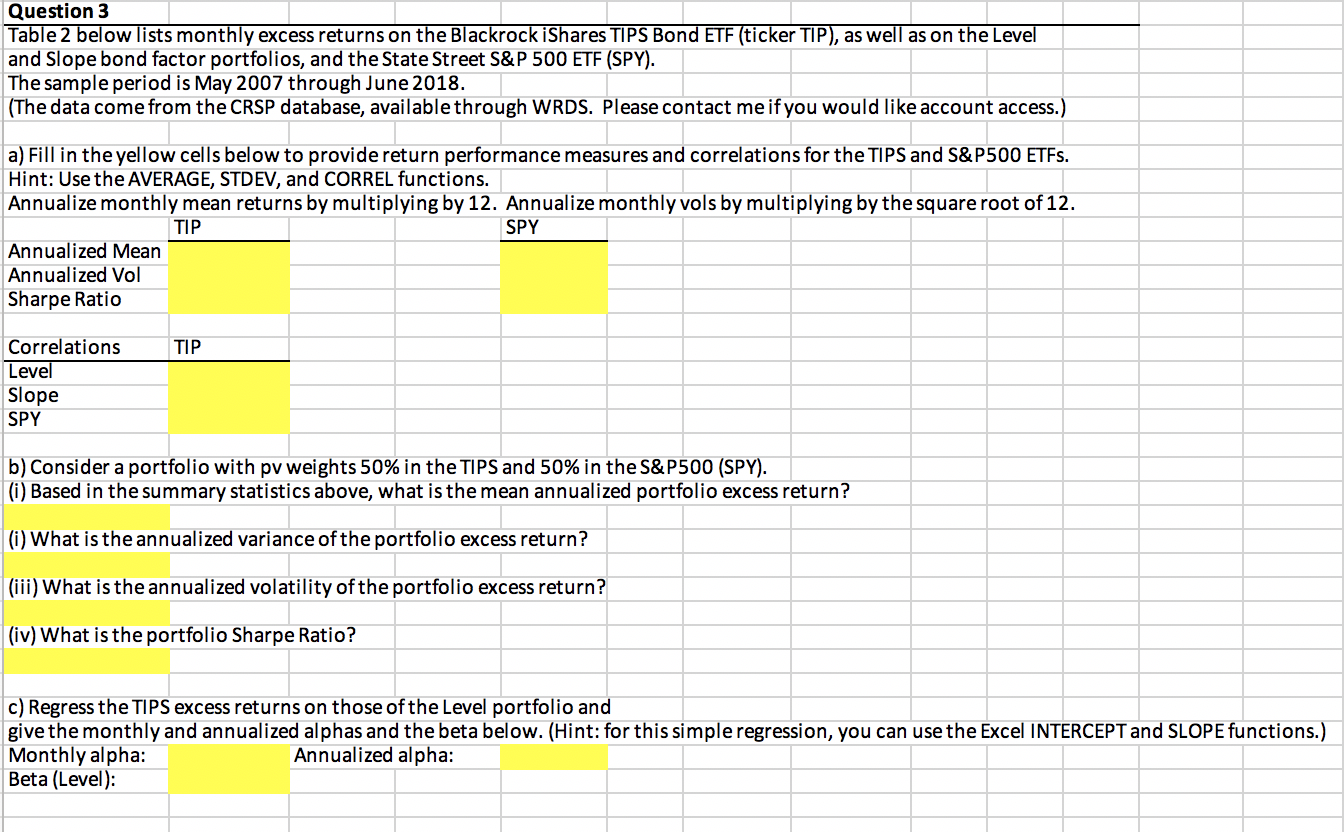
The table is below.


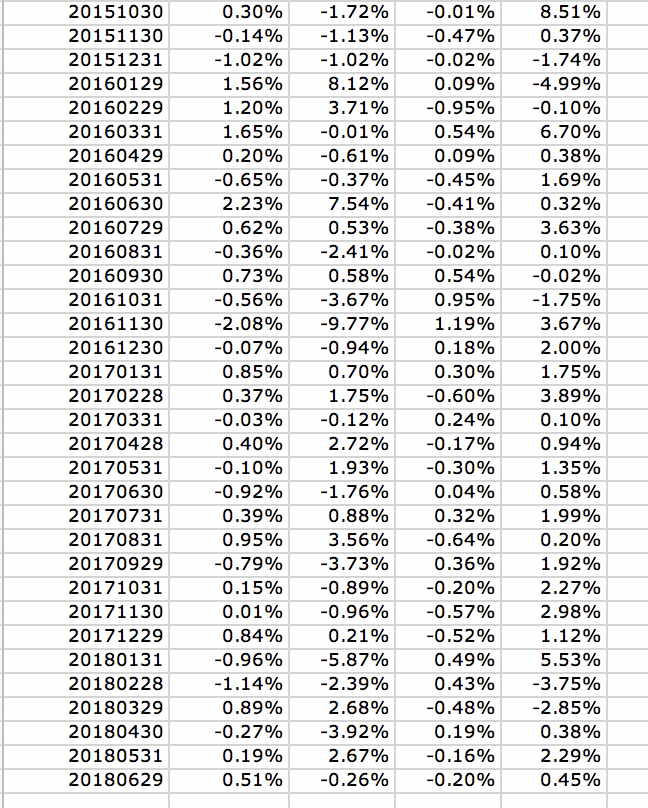
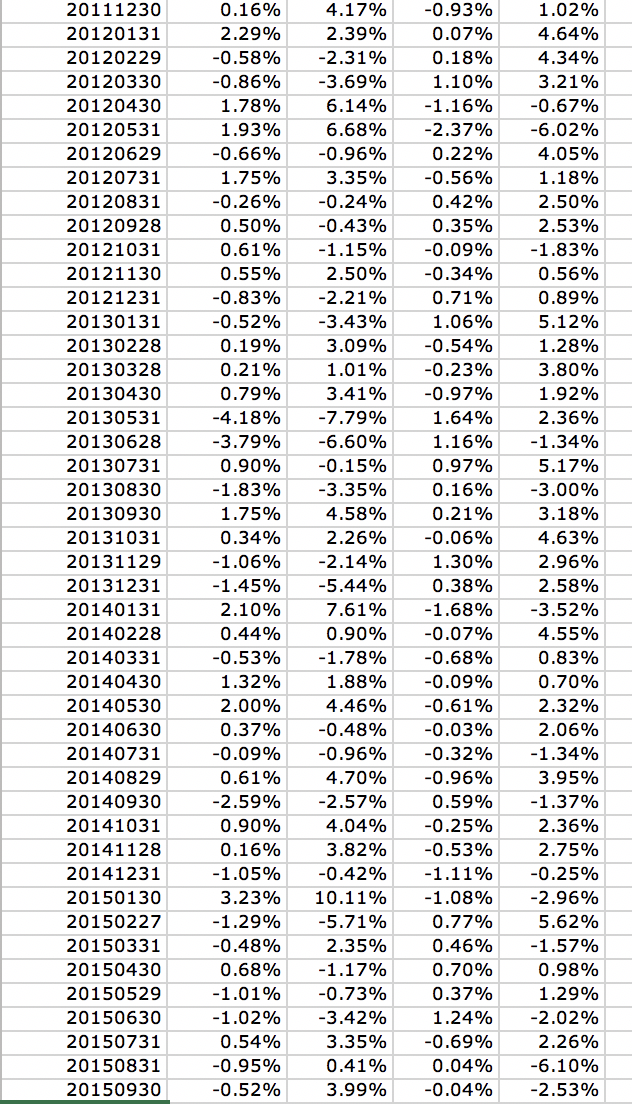
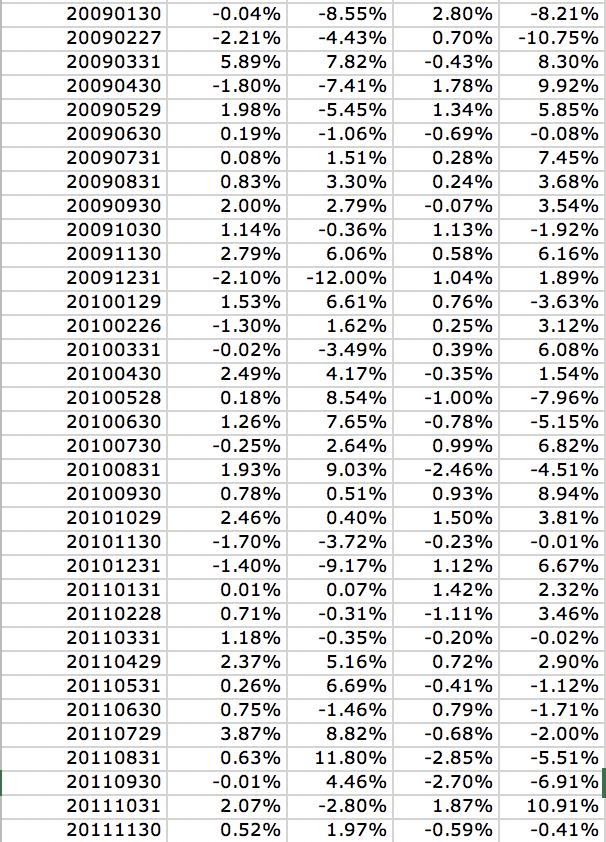
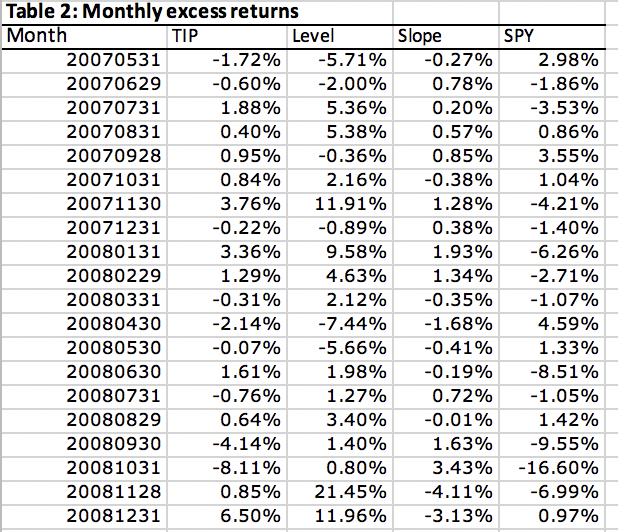
Question 3 Ta e2 e ow istsmont yexcess returnsont eB ac roc iS aresTIPS Bon ETF tic erTIP and Slope bond factor portfolios, and the State Street S&P 500 ETF (SPY). The sample period is May 2007 through June 2018. (The data come from the CRSP database, available through WRDS. Please contact me ifyou would like account access.) , aswe asont eLeve a) Fill in the yellow cells below to provide return performance measures and correlationsfortheTlPS and SS. P500 ETFs. Hint: Use the AVERAGE, STDEV, and CORREL functions. Annualize monthly mean returns by multiplying by 12. Annualize monthlyvols by multiplying bythe square root of 12. TIP SPY Annualized Mean Annualized Vol Sharpe Ratio Correlations TIP b) Consider a portfolio with pvweights 50% in the TI PS and 50% in the S&P500 (SPY). (i) Based in the summary statistics above, what isthe mean annualized portfolio excess return? (i)What isthe annualized variance ofthe portfolio excess return? (iii)What isthe annualized volatility ofthe portfolio excess return? (iv) What is the portfolio Sharpe Ratio? c) Regress theTlPS excess returns on those ofthe Level portfolio and give the monthly and annualized alphas and the beta below. (Hint: forthis simple regression, you can usethe Excel INTERCEPTand SLOPEfunctions.) Monthly alpha: Annualized alpha: Beta (Level)
Step by Step Solution
There are 3 Steps involved in it

Get step-by-step solutions from verified subject matter experts