

Question: can i get a different solution from the one posted before, dont upload the same solutions beacuse i didnt understand them. id prefer a handwritten
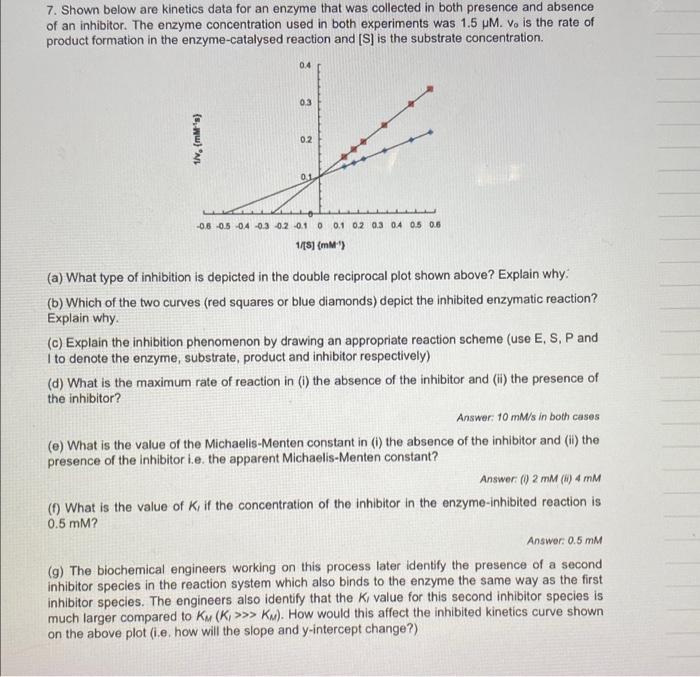
7. Shown below are kinetics data for an enzyme that was collected in both presence and absence of an inhibitor. The enzyme concentration used in both experiments was 1.5M.v0 is the rate of product formation in the enzyme-catalysed reaction and [S] is the substrate concentration. (a) What type of inhibition is depicted in the double reciprocal plot shown above? Explain why: (b) Which of the two curves (red squares or blue diamonds) depict the inhibited enzymatic reaction? Explain why. (c) Explain the inhibition phenomenon by drawing an appropriate reaction scheme (use E, S, P and I to denote the enzyme, substrate, product and inhibitor respectively) (d) What is the maximum rate of reaction in (i) the absence of the inhibitor and (ii) the presence of the inhibitor? Answer: 10mM/s in both cases (e) What is the value of the Michaelis-Menten constant in (i) the absence of the inhibitor and (ii) the presence of the inhibitor i.e. the apparent Michaelis-Menten constant? Answer (i) 2mM (i) 4mM (f) What is the value of K1 if the concentration of the inhibitor in the enzyme-inhibited reaction is 0.5mM ? Answer 0.5mM (g) The biochemical engineers working on this process later identify the presence of a second inhibitor species in the reaction system which also binds to the enzyme the same way as the first inhibitor species. The engineers also identify that the K1 value for this second inhibitor species is much larger compared to KM(K1>KM). How would this affect the inhibited kinetics curve shown on the above plot (i.e. how will the slope and y-intercept change?)
Step by Step Solution
There are 3 Steps involved in it

Get step-by-step solutions from verified subject matter experts