

Question: Can I get help Please. | B c D E F G H | J K L 6 General Instructions: Make sure to save this
Can I get help Please.
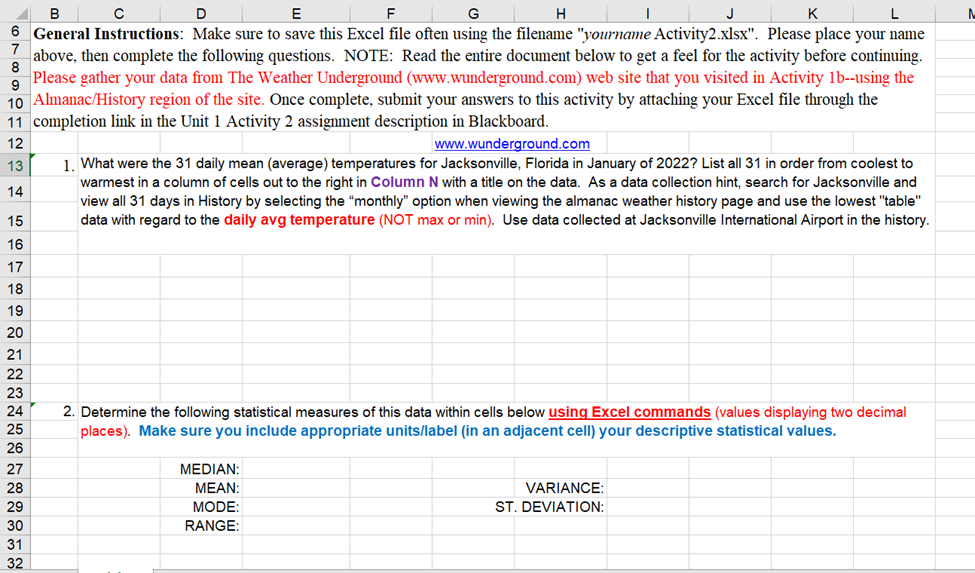
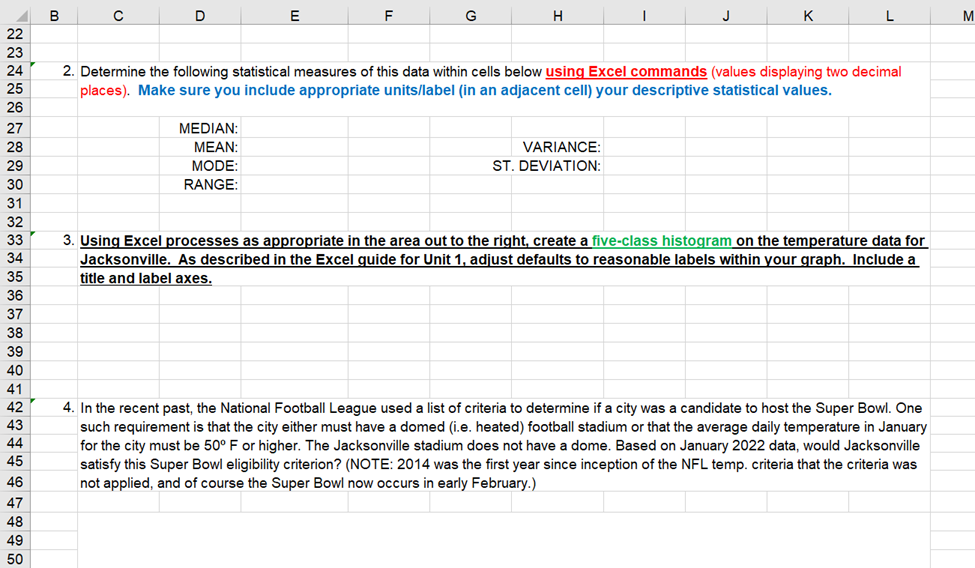
| B c D E F G H | J K L 6 General Instructions: Make sure to save this Excel file often using the filename "vourname Activity2 xlsx". Please place your name |above, then complete the following questions. NOTE: Read the entire document below to get a feel for the activity before continuing. g Please gather your data from The Weather Underground (www.wunderground.com) web site that you visited in Activity 1b--using the 10 |Almanac/History region of the site. Once complete, submit your answers to this activity by attaching your Excel file through the 11 completion link in the Unit 1 Activity 2 assignment description in Blackboard. 12 www.wunderground.com 13 l' 1. What were the 31 daily mean (average) temperatures for Jacksonville, Florida in January of 20227 List all 31 in order from coolest to 14 warmest in a column of cells out to the right in Column N with a title on the data. As a data collection hint, search for Jacksonville and i view all 31 days in History by selecting the \"monthly\" option when viewing the almanac weather history page and use the lowest "table\" 15 data with regard to the daily avg temperature (NOT max or min). Use data collected at Jacksonville International Airport in the history. 16 | 17 | 18 | 19 | 20 21 22 23| 24 ' 2. Determine the following statistical measures of this data within cells below using Excel commands (values displaying two decimal 25 places). Make sure you include appropriate units/label (in an adjacent cell) your descriptive statistical values. 26 27 MEDIAN: 28 | MEAN: VARIANCE: 29 | MODE: ST. DEVIATION: 30 | RANGE: 31| 32 22 23 24" 2. Determine the following statistical measures of this data within cells below using Excel commands (values displaying two decimal 25 | places). Make sure you include appropriate units/label (in an adjacent cell) your descriptive statistical values. 26 27 MEDIAN: 28 MEAN: VARIANCE: 29 MODE: ST. DEVIATION: 30 RANGE: 31 32 33" 3. Using Excel processes as appropriate in the area out to the right, create a five-class histogram_on the temperature data for 34 Jacksonville. As described in the Excel guide for Unit 1, adjust defaults to reasonable labels within your graph. Include a 35 title and label axes. 36 a7 38 39 40 41 427 4 Inthe recent past, the National Football League used a list of criteria to determine if a city was a candidate to host the Super Bowl. One 43 such requirement is that the city either must have a domed (i.e. heated) football stadium or that the average daily temperature in January 44 for the city must be 50 F or higher. The Jacksonville stadium does not have a dome. Based on January 2022 data, would Jacksonville 45 satisfy this Super Bowl eligibility criterion? (NOTE: 2014 was the first year since inception of the NFL temp. criteria that the criteria was 46 not applied, and of course the Super Bowl now occurs in early February.) 47 48 49 50
Step by Step Solution
There are 3 Steps involved in it

Get step-by-step solutions from verified subject matter experts