

Question: Can I get help with graphing this question please Using the information given in the table, draw the isoquant corresponding to an output level of
Can I get help with graphing this question please
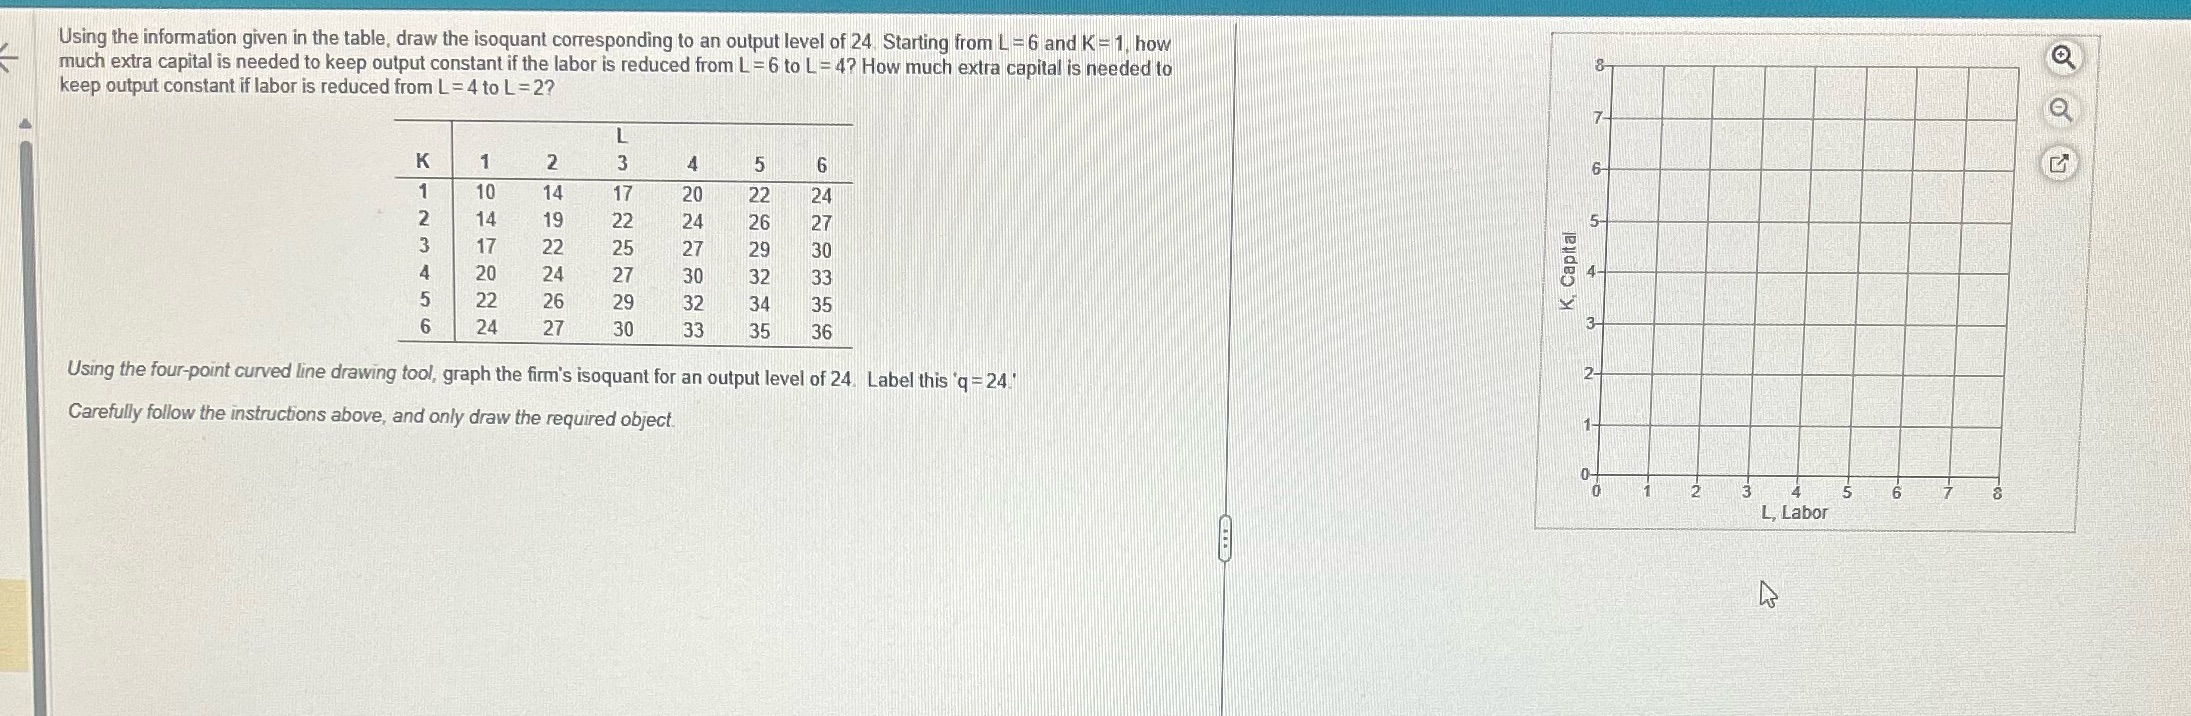
Using the information given in the table, draw the isoquant corresponding to an output level of 24 Starting from L - 6 and K - 1. how much extra capital is needed to keep output constant if the labor is reduced from L - 6 to L- 4? How much extra capital is needed to keep output constant if labor is reduced from L = 4 to L = 2? 2 4 5 10 14 17 20 22 24 26 27 K, Capital 14 19 22 24 29 30 17 22 25 27 QUAWN 20 24 27 30 32 33 22 26 29 32 34 35 24 27 30 33 35 36 N Using the four-point curved line drawing tool, graph the firm's isoquant for an output level of 24. Label this 'q =24." 6 Carefully follow the instructions above, and only draw the required object. L, Labor
Step by Step Solution
There are 3 Steps involved in it

Get step-by-step solutions from verified subject matter experts