

Question: can i get help with this questio:) Question 13 1 pts The weights of 20 cans of peach are randomly taken and measured every day
can i get help with this questio:) 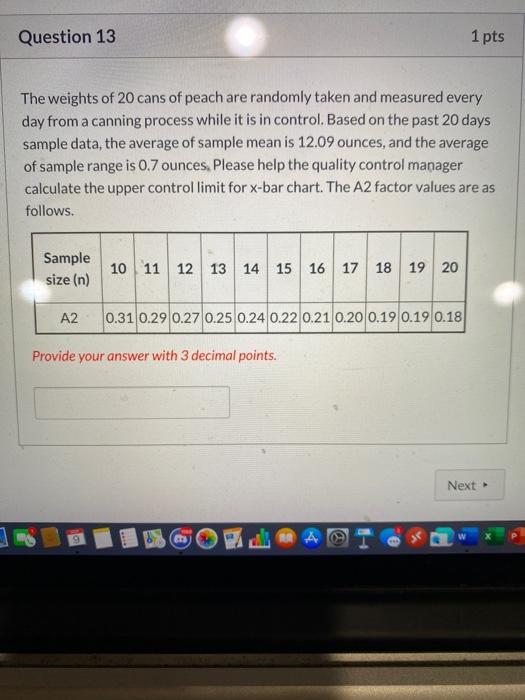
Question 13 1 pts The weights of 20 cans of peach are randomly taken and measured every day from a canning process while it is in control. Based on the past 20 days sample data, the average of sample mean is 12.09 ounces, and the average of sample range is 0.7 ounces. Please help the quality control manager calculate the upper controllimit for x-bar chart. The A2 factor values are as follows. Sample size (n) 10 11 12 13 14 15 16 17 18 19 20 A2 0.31 0.29 0.27 0.25 0.24 0.22 0.21 0.20 0.19 0.19 0.18 Provide your answer with 3 decimal points. Next > @
Step by Step Solution
There are 3 Steps involved in it
1 Expert Approved Answer
Step: 1 Unlock

Question Has Been Solved by an Expert!
Get step-by-step solutions from verified subject matter experts
Step: 2 Unlock
Step: 3 Unlock