

Question: Can I get some help please 3. O Given are five observations for two variables, a and y. x4 5 10 9 22 19 yi
Can I get some help please
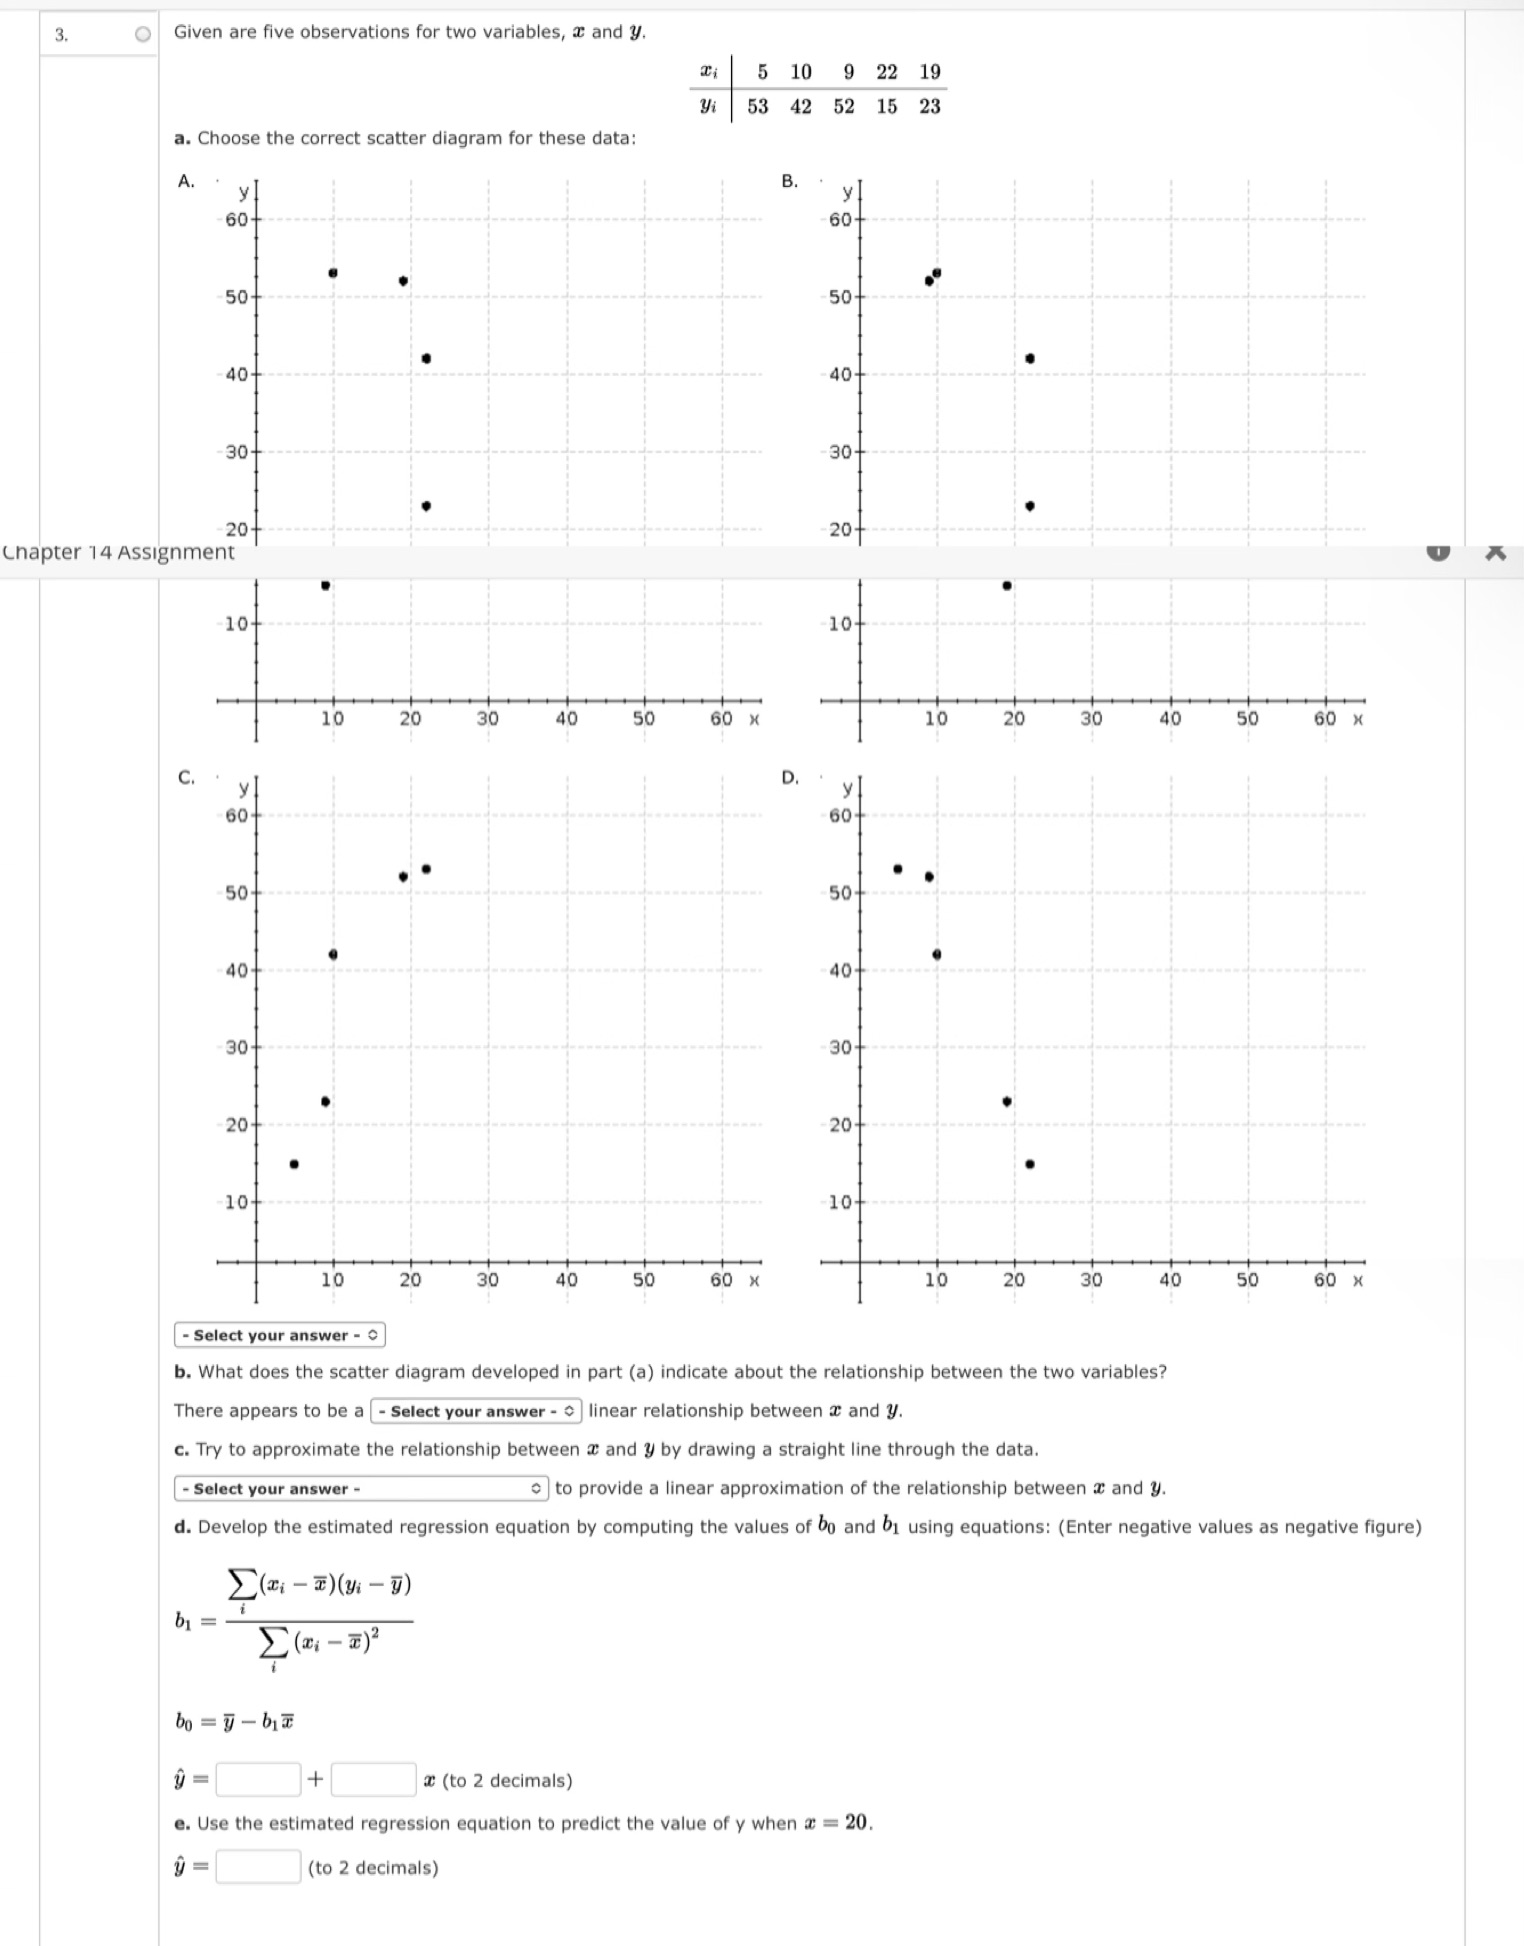
3. O Given are five observations for two variables, a and y. x4 5 10 9 22 19 yi 53 42 52 15 23 a. Choose the correct scatter diagram for these data: A. B. 60- 60- 50 50 40+ 40+ 30 30+ 20- 20 Chapter 14 Assignment 10- 10 10 20 30 40 50 60 X 10 20 30 40 50 60 x C. D. 60- 50+ 50 40- 40+ 30 30 20 20 10. 10 10 20 30 40 50 60 10 20 30 40 50 60 X - Select your answer - b. What does the scatter diagram developed in part (a) indicate about the relationship between the two variables? There appears to be a - Select your answer - | linear relationship between a and y. c. Try to approximate the relationship between a and 3 by drawing a straight line through the data. - Select your answer - to provide a linear approximation of the relationship between a and y. d. Develop the estimated regression equation by computing the values of bo and 61 using equations: (Enter negative values as negative figure) b1= bo = y - bla 1 = + (to 2 decimals) e. Use the estimated regression equation to predict the value of y when a = 20. y = (to 2 decimals)
Step by Step Solution
There are 3 Steps involved in it

Get step-by-step solutions from verified subject matter experts