

Question: can i get the answer ?? Q 1) Assume the following cost data are for a purely competitive producer: Total product |Average fixed cost |Average
can i get the answer ??
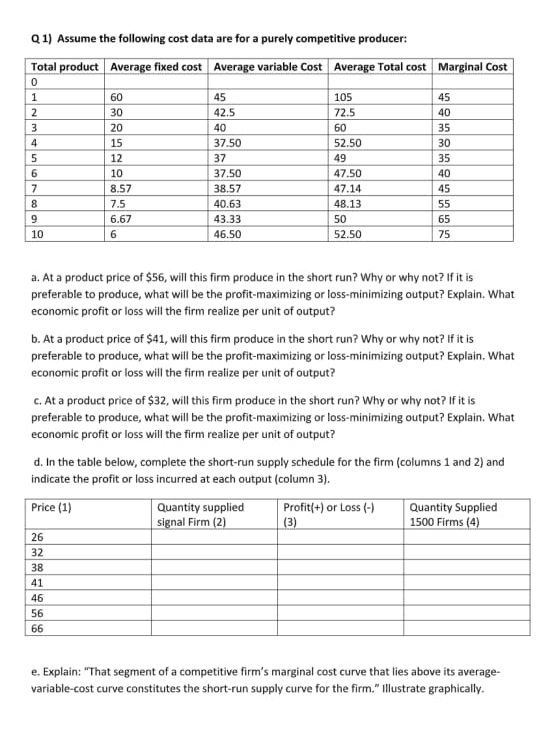
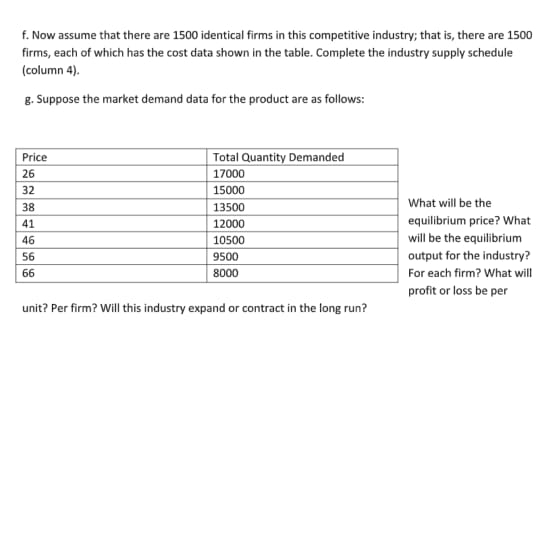
Q 1) Assume the following cost data are for a purely competitive producer: Total product |Average fixed cost |Average variable Cost |Average Total cost |Marginal Cost 0 1 60 45 105 45 2 30 42.5 72.5 40 3 20 40 60 35 4 15 37.50 52.50 30 5 12 37 49 35 6 10 37.50 47.50 40 7 8.57 38.57 47.14 45 8 7.5 40.63 48.13 55 9 6.67 43.33 50 65 10 6 46.50 52.50 75 a. At a product price of $56, will this firm produce in the short run? Why or why not? if it is preferable to produce, what will be the profit-maximizing or loss-minimizing output? Explain. What economic profit or loss will the firm realize per unit of output? b. At a product price of $41, will this firm produce in the short run? Why or why not? If it is preferable to produce, what will be the profit-maximizing or loss-minimizing output? Explain. What economic profit or loss will the firm realize per unit of output? C. At a product price of $32, will this firm produce in the short run? Why or why not? If it is preferable to produce, what will be the profit-maximizing or loss-minimizing output? Explain, What economic profit or loss will the firm realize per unit of output? d. In the table below, complete the short-run supply schedule for the firm (columns 1 and 2) and indicate the profit or loss incurred at each output (column 3). Price (1) Quantity supplied Profit(+) or Loss (-) Quantity Supplied signal Firm (2) (3) 1500 Firms (4) 26 32 38 41 46 56 66 e. Explain: "That segment of a competitive firm's marginal cost curve that lies above its average- variable-cost curve constitutes the short-run supply curve for the firm." Illustrate graphically.f. Now assume that there are 1500 identical firms in this competitive industry; that is, there are 1500 firms, each of which has the cost data shown in the table. Complete the industry supply schedule (column 4). g. Suppose the market demand data for the product are as follows: Price Total Quantity Demanded 26 17000 32 15000 38 13500 What will be the 41 12000 equilibrium price? What 46 10500 will be the equilibrium 56 9500 output for the industry? 66 8000 For each firm? What will profit or loss be per unit? Per firm? Will this industry expand or contract in the long run
Step by Step Solution
There are 3 Steps involved in it

Get step-by-step solutions from verified subject matter experts