

Question: CAN I PLEASE GET THE CORRECT R STUDIO CODE? Problem 1 Using the iris data frame, make a plot of that meets the following criteria:
CAN I PLEASE GET THE CORRECT R STUDIO CODE?
Problem
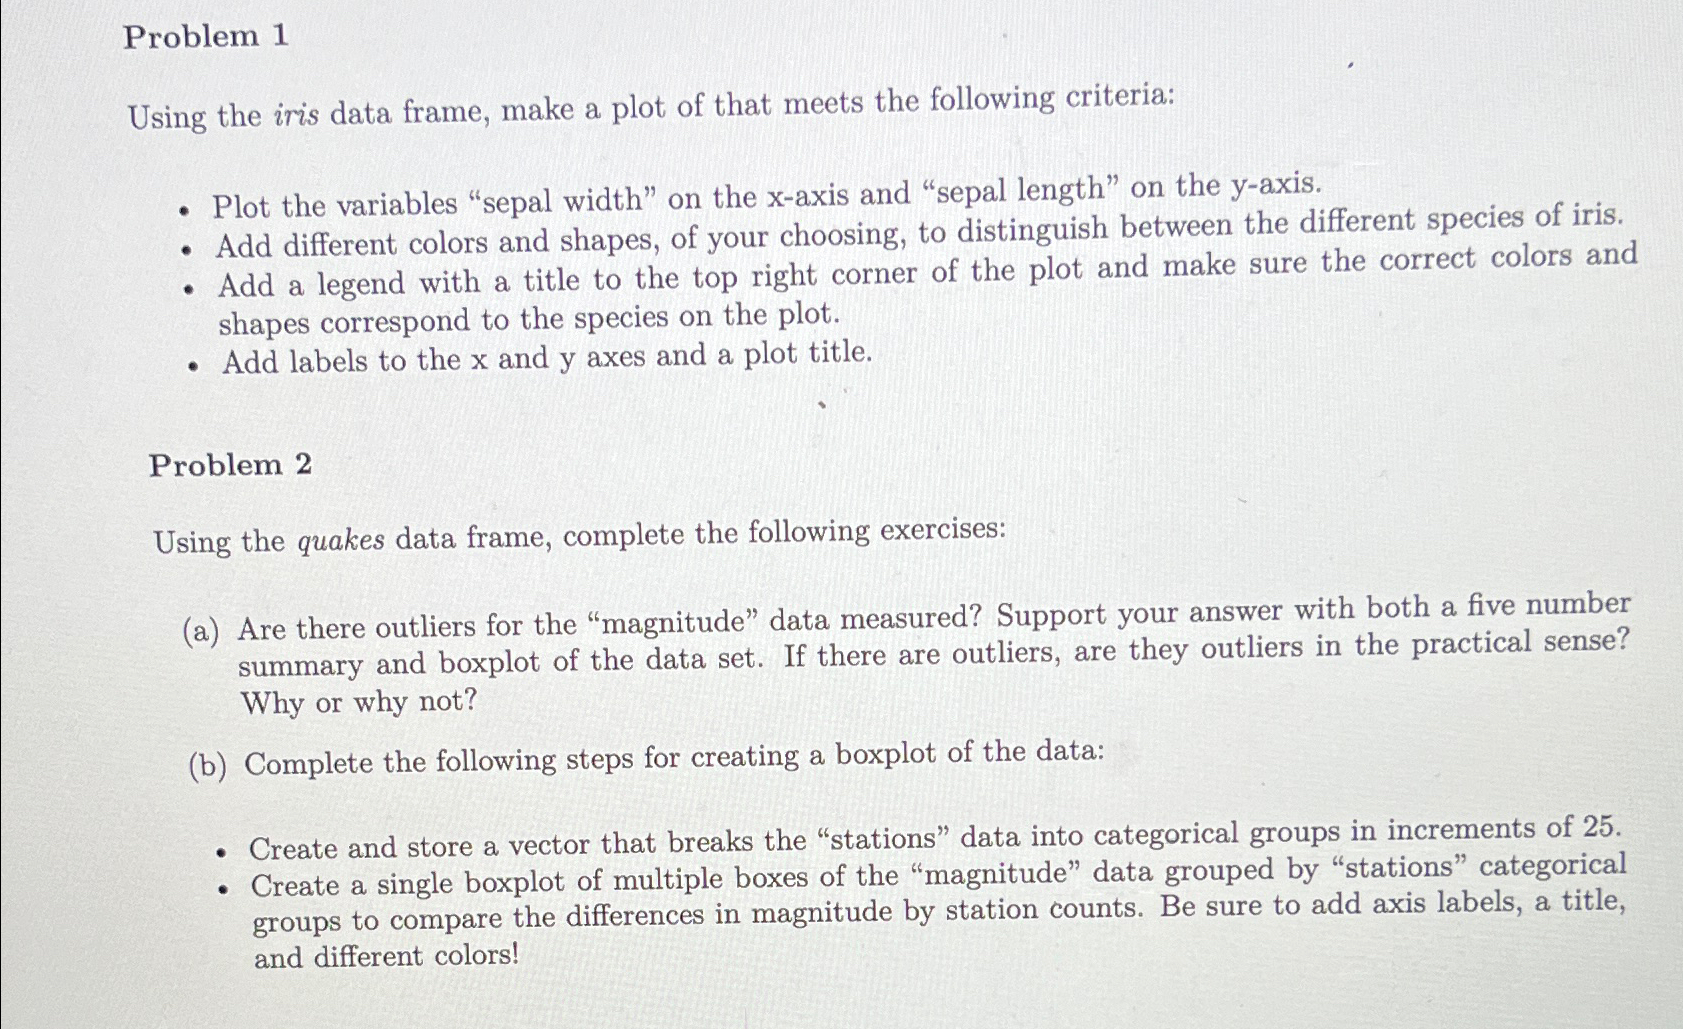
Using the iris data frame, make a plot of that meets the following criteria:
Plot the variables "sepal width" on the xaxis and "sepal length" on the yaxis.
Add different colors and shapes, of your choosing, to distinguish between the different species of iris.
Add a legend with a title to the top right corner of the plot and make sure the correct colors and shapes correspond to the species on the plot.
Add labels to the and axes and a plot title.
Problem
Using the quakes data frame, complete the following exercises:
a Are there outliers for the "magnitude" data measured? Support your answer with both a five number summary and boxplot of the data set. If there are outliers, are they outliers in the practical sense? Why or why not?
b Complete the following steps for creating a boxplot of the data:
Create and store a vector that breaks the "stations" data into categorical groups in increments of
Create a single boxplot of multiple boxes of the "magnitude" data grouped by "stations" categorical groups to compare the differences in magnitude by station counts. Be sure to add axis labels, a title, and different colors!
CAN I PLEASE GET THE CORRECT R STUDIO CODE?
Step by Step Solution
There are 3 Steps involved in it
1 Expert Approved Answer
Step: 1 Unlock

Question Has Been Solved by an Expert!
Get step-by-step solutions from verified subject matter experts
Step: 2 Unlock
Step: 3 Unlock