

Question: can i please get the steps to do this part on data table function on excel please to calculate npv b. Now conduct a sensitivity
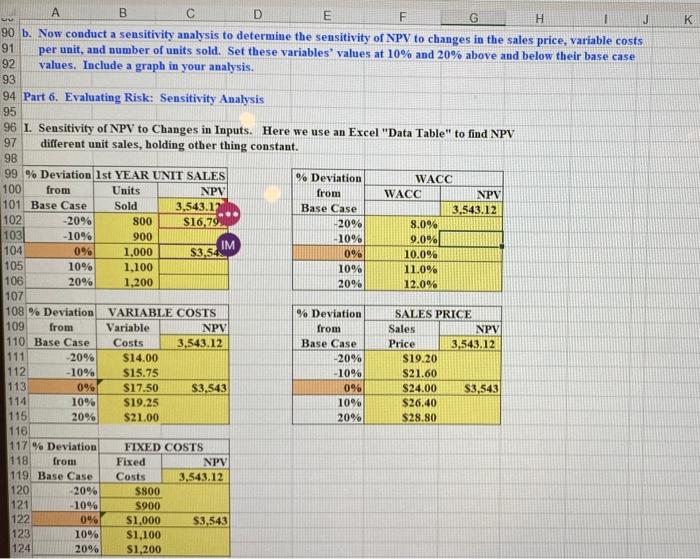
b. Now conduct a sensitivity analysis to determine the sensitivity of NPV to changes in the sales price, variable costs per unit, and number of units sold. Set these variables' values at 10% and 20% above and below their base case values. Include a graph in your analysis. Part 6. Evaluating Risk: Sensitivity Analysis 1. Sensitivity of NPV to Changes in Inputs. Here we use an Excel "Data Table" to find NPV different unit sales, holding other thing constant. b. Now conduct a sensitivity analysis to determine the sensitivity of NPV to changes in the sales price, variable costs per unit, and number of units sold. Set these variables' values at 10% and 20% above and below their base case values. Include a graph in your analysis. Part 6. Evaluating Risk: Sensitivity Analysis 1. Sensitivity of NPV to Changes in Inputs. Here we use an Excel "Data Table" to find NPV different unit sales, holding other thing constant
Step by Step Solution
There are 3 Steps involved in it

Get step-by-step solutions from verified subject matter experts