

Question: please complete letter B- (the information needed to complete will be attached in the pictures) .. please show excel formulas used. please complete letter B..
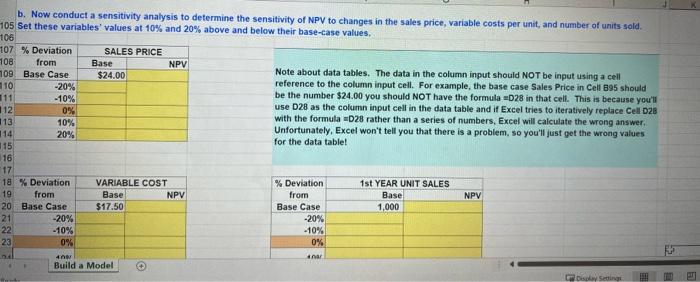

b. Now conduct a sensitivity analysis to determine the sensitivity of NPV to changes in the sales price, variable costs per unit, and number of units sold. 05 Set these variables' values at 10% and 20% above and below their base-case values. 106 107 % Deviation SALES PRICE 1108 from Base NPV 109 Base Case Note about data tables. The data in the column input should NOT be input using a cell $24.00 110 -20% reference to the column input cell. For example, the base case Sales Price in Cell 895 should 111 -10% be the number $24.00 you should NOT have the formula =D28 in that cell. This is because you'll 112 use D28 as the column input cell in the data table and if Excel tries to iteratively replace Cell D28 0% 13 with the formula =D28 rather than a series of numbers, Excel will calculate the wrong answer 10% 14 Unfortunately, Excel won't tell you that there is a problem, so you'll just get the wrong values 20% 115 for the data table! 16 17 18 % Deviation VARIABLE COST % Deviation 1st YEAR UNIT SALES 19 from NPV from Basel NPV 20 Base Case $17.50 Base Case 1,000 21 -20% -20% 22 -10% -10% 23 0% 0% 40 Build a Model Displaying 6 - -6865 Base ORKSRE 52.7% Ko Route NPV = RR PEDRO Bounted 239 2 1.000.00 $34.72 1.000.00 $25.46 1,000.00 $26.23 $13.12 1099 $26.225 11 10000 $24.00 SIT 1.000 134.000 12.072 $10.00 20.00% 12.000 50 $2.400 $10,000 1.030 134720 12.546 $10.000 32.00% $2.000 $10,000 19,20% 31.920 $10.000 11.52 $1.152 $1720 110.000 3500 24 25 input Data in thousands of dollars) 25 Equipment cost $10.000 276 104 20 First year of units 100 29 30 price per unit 124.00 30 Variable cost per uniter depe $17.50 31 Nonvariable costel Gepr.) $1.00 22 Martat valus ofcouipment at your $500 30 Tax rate 36 WACC 1000 35 Intation in prices and costa 20 Estimated svag var 37 3 nametes Caetons 39 Units sold 10 Sales price per unit al depr.) 41 Varubie costa per unit enclope Nonvarati contact es revenue Required level of niet operating working capital 5 Bans for depreciation Annual equipment pr. nate Annual depreciation pense Ending Br Vat: Cost - Accum Dept Salvage Value 50 Profit or low on salvage 51 Tax on profit or loss) 52 Net cash flow due to salvage 50 34 Cash Flow Forecast 55 Se revenue 56 Variable costo 57 Nonvariable operating costs 50 Depreciation equipment) 50 Oper income before (EBIT) 00 TAX on operating income (40%) 61 Net operating profit after taxes 2 Add back depreciation Equipment purchase 64 Cash flow due to change in NOWC 65 Net cash flow due to salvage Not Cash Flow Timeline of cash Tow) 88 Key Results Appraisal of the Proposed Project 20 Not Present Value jat 10%) $2.780 21 RR= 19.23% 72 MIRR 15.72% 73 Payback 2.50 74 Discounted Payback 3.39 75 Data for Payback Years 28 T Netcash flow Cumulative CF 79 Part of required for payback -5491 5901 Year . 125.462 18 SCE 1300 17.500 1.000 2.000 $3.500 140 32.100 4100 534720 10025 1,050 3.200 12465 1920 $2.715 1 SE 32.349 4209 4 2.225 19.123 1000 1.152 $4.50 1903 $2.915 UT $1479 4.679 -$10.000 $2.400 972 974 -470 $2.623 $991 . -$12.00 14020 GOS 54.133 1 . -$12.400 $12.400 Year 2 $4.005 $3.762 100 3 54.130 ses 0.90 . $7,115 0.00 100 22 Data for Discounted Payback Years 1 $4026 3 $4150 893BBE 2 54.905 31.00 . -$12.400 $12.00 $12.00 Netcash fow Discounted cash flow Cumulative CF Part of a required for discounted pack 4 K.679 SUSES 52.78 0.39 -90730 -$1783 100 LO 100 b. Now conduct a sensitivity analysis to determine the sensitivity of NPV to changes in the sales price, variable costs per unit, and number of units sold. 105 Set these variables' values at 10% and 20% above and below their base-case values. 106 107 % Deviation SALES PRICE 108 from Base NPV 109 Base Case Note about data tables. The data in the column input should NOT be input using a cell $24.00 110 -20% reference to the column input cell. For example, the base case Sales Price in Cell 895 should 111 -10% be the number $24.00 you should NOT have the formula 028 in that cell. This is because you'll 112 use D28 as the column input cell in the data table and if Excel tries to iteratively replace Cell D28 0% 13 with the formula 028 rather than a series of numbers, Excel will calculate the wrong answer. 10% 14 Unfortunately, Excel won't tell you that there is a problem, so you'll just get the wrong values 20% 115 for the data table! 16 17 18 % Deviation VARIABLE COST % Deviation 1st YEAR UNIT SALES 19 from NPV from Base NPV 20 Base Case $17.50 Base Case 1,000 21 -20% -20% 22 -10% -10% 23 0% = Base 0% 4 anar Build a Model Display setting 52.7% Kuta NPV = RR PAR Bounted 2 1.000.00 $3472 1.000.00 $25.46 1.000.00 $200 $150 1.000 14.000 $2.02 $10.00 20.00% 12.000 1.000.00 $26.23 $12.12 1053 $26.225 30 $2.400 $10.000 1.030 134720 12546 $10.000 32.00% 11 125.462 $2.000 $10,000 19,20% 31.120 $10,000 11.52% 11.152 $1720 110.000 3500 24 25 Input Data in thousands of dollars) 25 Equipment cost $10,000 276 109 20 First year sale in unita 29 30 price per unit 124.00 30 Variabrost per united depe $17.50 31 Nonvariable costel Gepr.) $1.00 2. Martat value of equipment at your $500 30 Tax rate 4045 WACC 10 5 Intation in prices and costa 304 > Estimated wage Valur 37 3 nomear Caloons 9 Units sold 10 Sales price per unit al depr.) 41 Varubia costa per unit oldape) Nonvarati contact det es revenue 4 Required level of niet operating working capital Basis for depreciation 08 Annual equipment Gepr. rate Annual depreciation expense Ending Br Vat: Cost - Accum Dept Salvage Value 50 Profit for os on aivage 51 Tax on profit for 108) 52 Not con tow due to salvage 50 54 Cash Flow Forecast 55 Se revenue 56 Variable costo 57 Nonvariable operating costs 50 Depreciation equipment 50 Oper. Income befort (EBIT) 00 TAX on operating Income (40%) 61 Nat operating profit after tanes 2 Add back depreciation Equipment purchases 64 Cash flow due to change in NOWC 68 Met cash now due to salvage 06 Not Cash Flow Timeline of cash Tow) 66 Key Results: Appearsal of the Proposed Project 20 Net Present Value jat 10%) $2.780 21 RR 19.23% 72 MIRR 72 Payback 2.50 74 Discounted Payback 3:39 75 Data for PDC Years 70 T7 Netcash now Cumulative CF Part of required for peback -$1.220 5491 3931 Year 125.062 18. SC 4 32.225 19.123 200 17.500 1600 2.000 $3.500 400 32.100 4.100 524722 10025 1.030 3.200 12.455 1920 33.15 1 SE 32.349 420 1.152 $4.50 1983 $2.915 $149 46 -$10.000 -$2.400 -872 974 670 $2.623 $991 3. -$12.00 H20 HOS 54.133 Years 1 54.626 -$12.400 $12.400 $4.005 $3.767 100 3 54.130 sas 0.90 . $7,115 0.00 100 2 Data for Discounted Payback Years 3 4.153 8,982BBS Netcash row Discounted cash flow Cumulative CF Part of a required for discounted pack . $12.400 -612.400 -$12.400 1 54.128 33.000 -90730 2 14.05 33.00 -54333 100 4 K.689 14.SE $2.78 0:39 -51783 1 WEE 111 1:1:1 T. re NACE b. Now conduct a sensitivity analysis to determine the sensitivity of NPV to changes in the sales price, variable costs per unit, and number of units sold. 05 Set these variables' values at 10% and 20% above and below their base-case values. 106 107 % Deviation SALES PRICE 1108 from Base NPV 109 Base Case Note about data tables. The data in the column input should NOT be input using a cell $24.00 110 -20% reference to the column input cell. For example, the base case Sales Price in Cell 895 should 111 -10% be the number $24.00 you should NOT have the formula =D28 in that cell. This is because you'll 112 use D28 as the column input cell in the data table and if Excel tries to iteratively replace Cell D28 0% 13 with the formula =D28 rather than a series of numbers, Excel will calculate the wrong answer 10% 14 Unfortunately, Excel won't tell you that there is a problem, so you'll just get the wrong values 20% 115 for the data table! 16 17 18 % Deviation VARIABLE COST % Deviation 1st YEAR UNIT SALES 19 from NPV from Basel NPV 20 Base Case $17.50 Base Case 1,000 21 -20% -20% 22 -10% -10% 23 0% 0% 40 Build a Model Displaying 6 - -6865 Base ORKSRE 52.7% Ko Route NPV = RR PEDRO Bounted 239 2 1.000.00 $34.72 1.000.00 $25.46 1,000.00 $26.23 $13.12 1099 $26.225 11 10000 $24.00 SIT 1.000 134.000 12.072 $10.00 20.00% 12.000 50 $2.400 $10,000 1.030 134720 12.546 $10.000 32.00% $2.000 $10,000 19,20% 31.920 $10.000 11.52 $1.152 $1720 110.000 3500 24 25 input Data in thousands of dollars) 25 Equipment cost $10.000 276 104 20 First year of units 100 29 30 price per unit 124.00 30 Variable cost per uniter depe $17.50 31 Nonvariable costel Gepr.) $1.00 22 Martat valus ofcouipment at your $500 30 Tax rate 36 WACC 1000 35 Intation in prices and costa 20 Estimated svag var 37 3 nametes Caetons 39 Units sold 10 Sales price per unit al depr.) 41 Varubie costa per unit enclope Nonvarati contact es revenue Required level of niet operating working capital 5 Bans for depreciation Annual equipment pr. nate Annual depreciation pense Ending Br Vat: Cost - Accum Dept Salvage Value 50 Profit or low on salvage 51 Tax on profit or loss) 52 Net cash flow due to salvage 50 34 Cash Flow Forecast 55 Se revenue 56 Variable costo 57 Nonvariable operating costs 50 Depreciation equipment) 50 Oper income before (EBIT) 00 TAX on operating income (40%) 61 Net operating profit after taxes 2 Add back depreciation Equipment purchase 64 Cash flow due to change in NOWC 65 Net cash flow due to salvage Not Cash Flow Timeline of cash Tow) 88 Key Results Appraisal of the Proposed Project 20 Not Present Value jat 10%) $2.780 21 RR= 19.23% 72 MIRR 15.72% 73 Payback 2.50 74 Discounted Payback 3.39 75 Data for Payback Years 28 T Netcash flow Cumulative CF 79 Part of required for payback -5491 5901 Year . 125.462 18 SCE 1300 17.500 1.000 2.000 $3.500 140 32.100 4100 534720 10025 1,050 3.200 12465 1920 $2.715 1 SE 32.349 4209 4 2.225 19.123 1000 1.152 $4.50 1903 $2.915 UT $1479 4.679 -$10.000 $2.400 972 974 -470 $2.623 $991 . -$12.00 14020 GOS 54.133 1 . -$12.400 $12.400 Year 2 $4.005 $3.762 100 3 54.130 ses 0.90 . $7,115 0.00 100 22 Data for Discounted Payback Years 1 $4026 3 $4150 893BBE 2 54.905 31.00 . -$12.400 $12.00 $12.00 Netcash fow Discounted cash flow Cumulative CF Part of a required for discounted pack 4 K.679 SUSES 52.78 0.39 -90730 -$1783 100 LO 100 b. Now conduct a sensitivity analysis to determine the sensitivity of NPV to changes in the sales price, variable costs per unit, and number of units sold. 105 Set these variables' values at 10% and 20% above and below their base-case values. 106 107 % Deviation SALES PRICE 108 from Base NPV 109 Base Case Note about data tables. The data in the column input should NOT be input using a cell $24.00 110 -20% reference to the column input cell. For example, the base case Sales Price in Cell 895 should 111 -10% be the number $24.00 you should NOT have the formula 028 in that cell. This is because you'll 112 use D28 as the column input cell in the data table and if Excel tries to iteratively replace Cell D28 0% 13 with the formula 028 rather than a series of numbers, Excel will calculate the wrong answer. 10% 14 Unfortunately, Excel won't tell you that there is a problem, so you'll just get the wrong values 20% 115 for the data table! 16 17 18 % Deviation VARIABLE COST % Deviation 1st YEAR UNIT SALES 19 from NPV from Base NPV 20 Base Case $17.50 Base Case 1,000 21 -20% -20% 22 -10% -10% 23 0% = Base 0% 4 anar Build a Model Display setting 52.7% Kuta NPV = RR PAR Bounted 2 1.000.00 $3472 1.000.00 $25.46 1.000.00 $200 $150 1.000 14.000 $2.02 $10.00 20.00% 12.000 1.000.00 $26.23 $12.12 1053 $26.225 30 $2.400 $10.000 1.030 134720 12546 $10.000 32.00% 11 125.462 $2.000 $10,000 19,20% 31.120 $10,000 11.52% 11.152 $1720 110.000 3500 24 25 Input Data in thousands of dollars) 25 Equipment cost $10,000 276 109 20 First year sale in unita 29 30 price per unit 124.00 30 Variabrost per united depe $17.50 31 Nonvariable costel Gepr.) $1.00 2. Martat value of equipment at your $500 30 Tax rate 4045 WACC 10 5 Intation in prices and costa 304 > Estimated wage Valur 37 3 nomear Caloons 9 Units sold 10 Sales price per unit al depr.) 41 Varubia costa per unit oldape) Nonvarati contact det es revenue 4 Required level of niet operating working capital Basis for depreciation 08 Annual equipment Gepr. rate Annual depreciation expense Ending Br Vat: Cost - Accum Dept Salvage Value 50 Profit for os on aivage 51 Tax on profit for 108) 52 Not con tow due to salvage 50 54 Cash Flow Forecast 55 Se revenue 56 Variable costo 57 Nonvariable operating costs 50 Depreciation equipment 50 Oper. Income befort (EBIT) 00 TAX on operating Income (40%) 61 Nat operating profit after tanes 2 Add back depreciation Equipment purchases 64 Cash flow due to change in NOWC 68 Met cash now due to salvage 06 Not Cash Flow Timeline of cash Tow) 66 Key Results: Appearsal of the Proposed Project 20 Net Present Value jat 10%) $2.780 21 RR 19.23% 72 MIRR 72 Payback 2.50 74 Discounted Payback 3:39 75 Data for PDC Years 70 T7 Netcash now Cumulative CF Part of required for peback -$1.220 5491 3931 Year 125.062 18. SC 4 32.225 19.123 200 17.500 1600 2.000 $3.500 400 32.100 4.100 524722 10025 1.030 3.200 12.455 1920 33.15 1 SE 32.349 420 1.152 $4.50 1983 $2.915 $149 46 -$10.000 -$2.400 -872 974 670 $2.623 $991 3. -$12.00 H20 HOS 54.133 Years 1 54.626 -$12.400 $12.400 $4.005 $3.767 100 3 54.130 sas 0.90 . $7,115 0.00 100 2 Data for Discounted Payback Years 3 4.153 8,982BBS Netcash row Discounted cash flow Cumulative CF Part of a required for discounted pack . $12.400 -612.400 -$12.400 1 54.128 33.000 -90730 2 14.05 33.00 -54333 100 4 K.689 14.SE $2.78 0:39 -51783 1 WEE 111 1:1:1 T. re NACE
Step by Step Solution
There are 3 Steps involved in it

Get step-by-step solutions from verified subject matter experts