

Question: can i please have help solving these problems. thank you. $ 22,200 169, 100 68,300 102,800 30,000 $392,400 Gil's Fish and Tackle, Inc. Balance Sheet
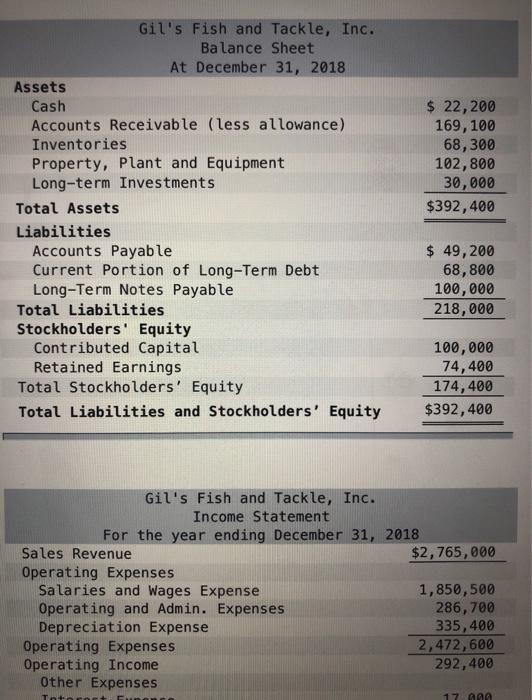
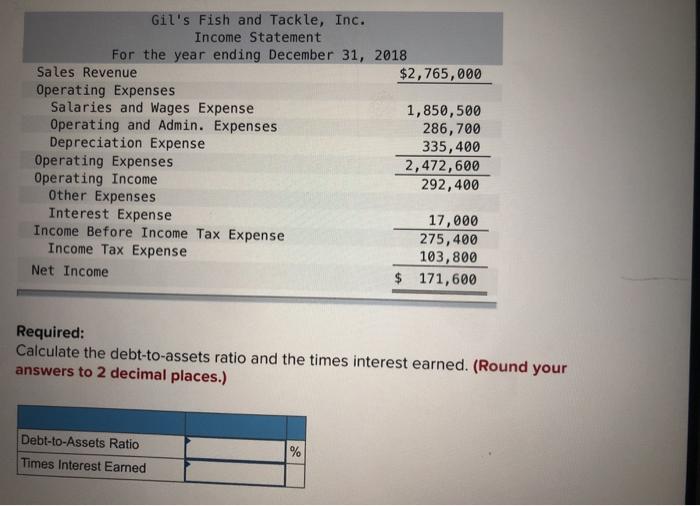
$ 22,200 169, 100 68,300 102,800 30,000 $392,400 Gil's Fish and Tackle, Inc. Balance Sheet At December 31, 2018 Assets Cash Accounts Receivable (less allowance) Inventories Property, plant and Equipment Long-term Investments Total Assets Liabilities Accounts Payable Current Portion of Long-Term Debt Long-Term Notes Payable Total Liabilities Stockholders' Equity Contributed Capital Retained Earnings Total Stockholders' Equity Total Liabilities and Stockholders' Equity $ 49,200 68,800 100,000 218,000 100,000 74,400 174,400 $392,400 Gil's Fish and Tackle, Inc. Income Statement For the year ending December 31, 2018 Sales Revenue $2,765,000 Operating Expenses Salaries and Wages Expense 1,850,500 Operating and Admin. Expenses 286,700 Depreciation Expense 335,400 Operating Expenses 2,472,600 Operating Income 292,400 Other Expenses To 17 Gil's Fish and Tackle, Inc. Income Statement For the year ending December 31, 2018 Sales Revenue $2,765,000 Operating Expenses Salaries and Wages Expense 1,850,500 Operating and Admin. Expenses 286,700 Depreciation Expense 335,400 Operating Expenses 2,472,600 Operating Income 292,400 Other Expenses Interest Expense 17,000 Income Before Income Tax Expense 275,400 Income Tax Expense 103,800 Net Income $ 171,600 Required: Calculate the debt-to-assets ratio and the times interest earned. (Round your answers to 2 decimal places.) Debt-to-Assets Ratio Times Interest Earned %
Step by Step Solution
There are 3 Steps involved in it

Get step-by-step solutions from verified subject matter experts