

Question: can (MATLAB) can I use a simple coding one for this question? a(t): the graph in red b(t): the graph in blue For all the
 can (MATLAB) can I use a simple coding one for this question?
a(t): the graph in red
b(t): the graph in blue
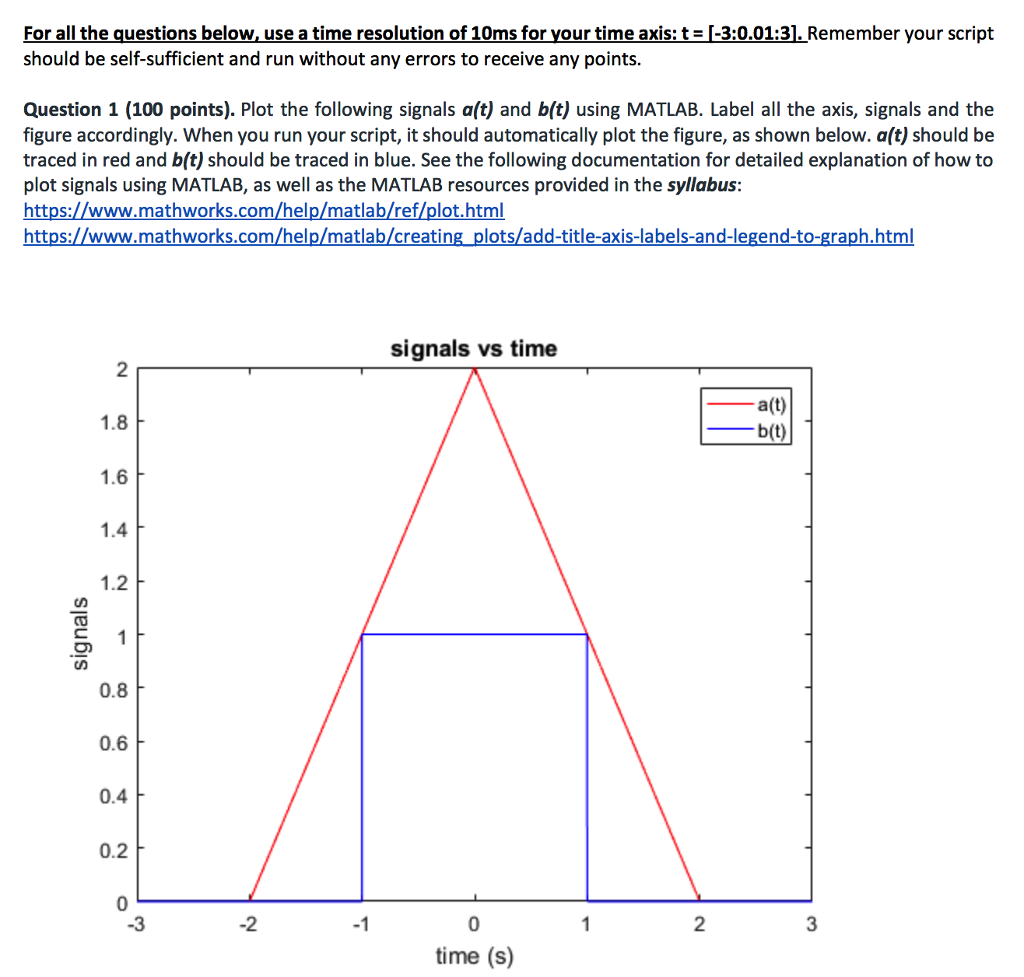
For all the questions below, use a time resolution of 10ms for your time axis: t = [-3:0.013]. Remember your script should be self-sufficient and run without any errors to receive any points. Question 1 (100 points). Plot the following signals a(t) and b(t) using MATLAB. Label all the axis, signals and the figure accordingly. When you run your script, it should automatically plot the figure, as shown below. a(t) should be traced in red and b(t) should be traced in blue. See the following documentation for detailed explanation of how to plot signals using MATLAB, as well as the MATLAB resources provided in the syllabus: https://www.mathworks.com/help/matlab/ref/plot.html https://www.mathworks.com/help/matlab/creating_plots/add-title-axis-labels-and-legend-to-graph.html signals vs time 2 a(t) b(t) 1.6 1.4 1.2 1 0.8 0.6 0.4 0.2 0 -3 1 2 time (s)
Step by Step Solution
There are 3 Steps involved in it

Get step-by-step solutions from verified subject matter experts