

Question: can some one help me with this? a) to represent an association between two numerical variables? b) to summarize the data in the table below
can some one help me with this?
a) to represent an association between two numerical variables?
b) to summarize the data in the table below (see pic) which goes total seroprevalence of herpes type I an II (% of people demonstrating the condition, out of the samples that were taken and analyzed)
for part c-e examine the pic below, which indicates the percentage of adult people living with HIV ( from the World Health Organization)
c)what type of graph is shown?
d) what is the response variable?
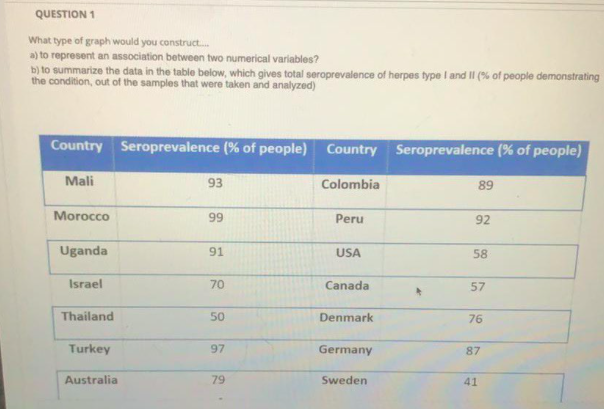
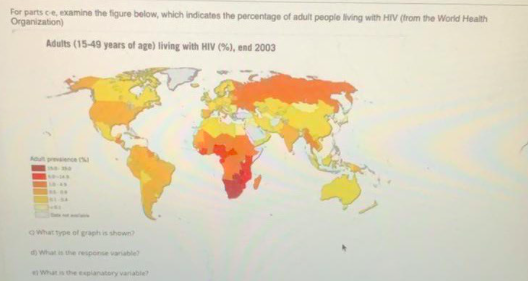
QUESTION 1 What type of graph would you construct... aj to represent an association between two numerical variables? b) to summarize the data in the table below, which gives total seroprevalence of herpes type I and II (% of people demonstrating the condition, out of the samples that were taken and analyzed) Country Seroprevalence (% of people) Country Seroprevalence (% of people) Mali 93 Colombia 89 Morocco 99 Peru 92 Uganda 91 USA 58 Israel 70 Canada 57 Thailand 50 Denmark 76 Turkey 97 Germany 87 Australia 79 Sweden 41For parts ce, examine the figure below, which indicates the percentage of adult people living with HIV (from the World Health Organization) Adults (15-49 years of age) living with HIV (%), end 2003 What type of puphin shown? ni what n by explanatory vanable
Step by Step Solution
There are 3 Steps involved in it

Get step-by-step solutions from verified subject matter experts