

Question: can some one help me with this b. Using vertical analysis, prepare a comparative balance sheet. If required, round your answers to one decimal place.


can some one help me with this
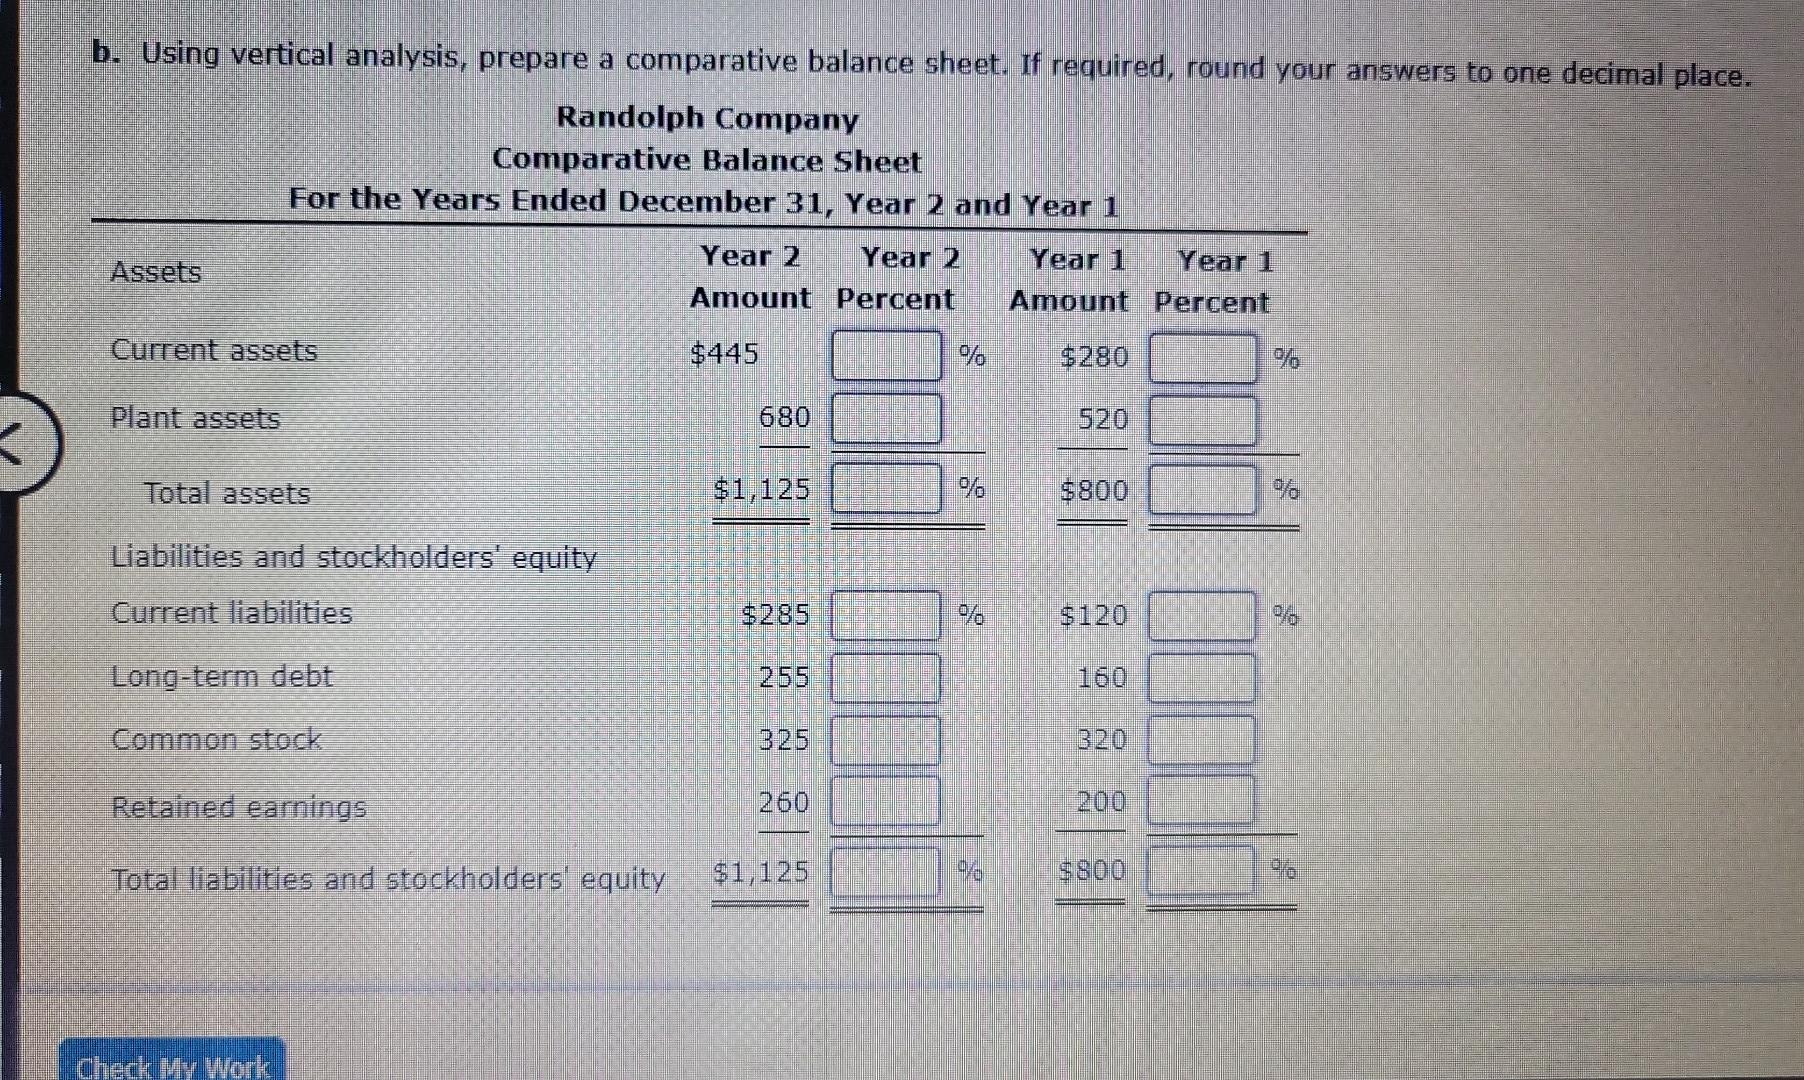
b. Using vertical analysis, prepare a comparative balance sheet. If required, round your answers to one decimal place. Randolph Company Comparative Balance Sheet For the Years Ended December 31, Year 2 and Year 1 Year 2 Year 2 Assets Year 1 Year 1 Amount Percent Amount Percent Current assets $445 $280 Plant assets 680 520 Total assets $1,125 $800 % Liabilities and stockholders' equity Current liabilities $285 $120 Long-term debt 160 Common stock 325 320 Retained earnings 260 200 Total liabilities and stockholders' equity $1,125 $800 Check My Work % ON % b. Using vertical analysis, prepare a comparative balance sheet. If required, round your answers to one decimal place. Randolph Company Comparative Balance Sheet For the Years Ended December 31, Year 2 and Year 1 Year 2 Year 2 Assets Year 1 Year 1 Amount Percent Amount Percent Current assets $445 $280 Plant assets 680 520 Total assets $1,125 $800 % Liabilities and stockholders' equity Current liabilities $285 $120 Long-term debt 160 Common stock 325 320 Retained earnings 260 200 Total liabilities and stockholders' equity $1,125 $800 Check My Work % ON % b. Using vertical analysis, prepare a comparative balance sheet. If required, round your answers to one decimal place. Randolph Company Comparative Balance Sheet For the Years Ended December 31, Year 2 and Year 1 Year 2 Year 2 Assets Year 1 Year 1 Amount Percent Amount Percent Current assets $445 $280 Plant assets 680 520 Total assets $1,125 $800 % Liabilities and stockholders' equity Current liabilities $285 $120 Long-term debt 160 Common stock 325 320 Retained earnings 260 200 Total liabilities and stockholders' equity $1,125 $800 Check My Work % ON % b. Using vertical analysis, prepare a comparative balance sheet. If required, round your answers to one decimal place. Randolph Company Comparative Balance Sheet For the Years Ended December 31, Year 2 and Year 1 Year 2 Year 2 Assets Year 1 Year 1 Amount Percent Amount Percent Current assets $445 $280 Plant assets 680 520 Total assets $1,125 $800 % Liabilities and stockholders' equity Current liabilities $285 $120 Long-term debt 160 Common stock 325 320 Retained earnings 260 200 Total liabilities and stockholders' equity $1,125 $800 Check My Work % ON % b. Using vertical analysis, prepare a comparative balance sheet. If required, round your answers to one decimal place. Randolph Company Comparative Balance Sheet For the Years Ended December 31, Year 2 and Year 1 Year 2 Year 2 Assets Year 1 Year 1 Amount Percent Amount Percent Current assets $445 $280 Plant assets 680 520 Total assets $1,125 $800 % Liabilities and stockholders' equity Current liabilities $285 $120 Long-term debt 160 Common stock 325 320 Retained earnings 260 200 Total liabilities and stockholders' equity $1,125 $800 Check My Work % ON % b. Using vertical analysis, prepare a comparative balance sheet. If required, round your answers to one decimal place. Randolph Company Comparative Balance Sheet For the Years Ended December 31, Year 2 and Year 1 Year 2 Year 2 Assets Year 1 Year 1 Amount Percent Amount Percent Current assets $445 $280 Plant assets 680 520 Total assets $1,125 $800 % Liabilities and stockholders' equity Current liabilities $285 $120 Long-term debt 160 Common stock 325 320 Retained earnings 260 200 Total liabilities and stockholders' equity $1,125 $800 Check My Work % ON %
Step by Step Solution
There are 3 Steps involved in it

Get step-by-step solutions from verified subject matter experts