

Question: can someone explain how to solve the first chart for me Calculations (for Trial 1) (Include units) (include units) 90 90 78 C 75 C
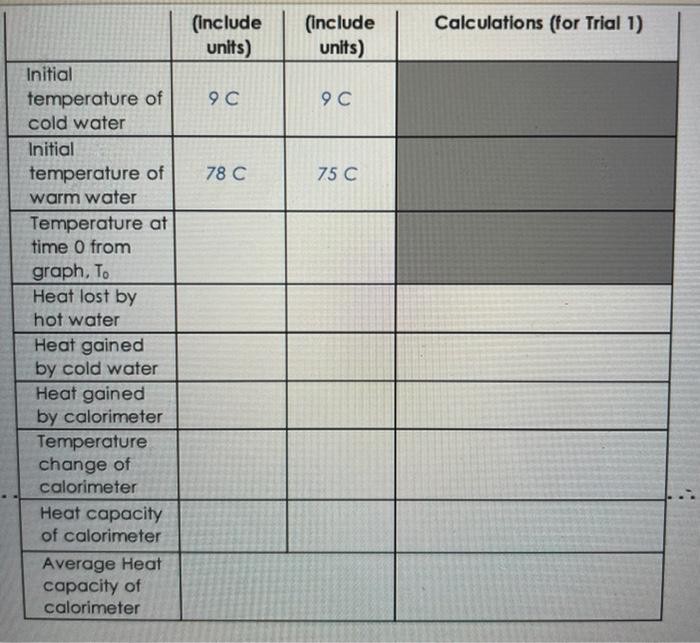
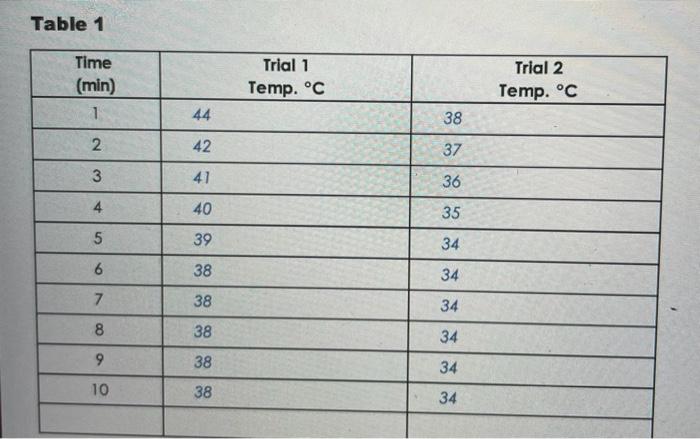
Calculations (for Trial 1) (Include units) (include units) 90 90 78 C 75 C Initial temperature of cold water Initial temperature of warm water Temperature at time O from graph, T. Heat lost by hot water Heat gained by cold water Heat gained by calorimeter Temperature change of calorimeter Heat capacity of calorimeter Average Heat capacity of calorimeter Table 1 Trial 2 Time (min) 1 Trial 1 Temp. C Temp. C 44 38 2 42 37 3 41 36 3 4 4 40 35 an 5 39 34 6 38 34 7 38 34 8 38 34 9 38 34 10 38 34 Calculations (for Trial 1) (Include units) (include units) 90 90 78 C 75 C Initial temperature of cold water Initial temperature of warm water Temperature at time O from graph, T. Heat lost by hot water Heat gained by cold water Heat gained by calorimeter Temperature change of calorimeter Heat capacity of calorimeter Average Heat capacity of calorimeter Table 1 Trial 2 Time (min) 1 Trial 1 Temp. C Temp. C 44 38 2 42 37 3 41 36 3 4 4 40 35 an 5 39 34 6 38 34 7 38 34 8 38 34 9 38 34 10 38 34
Step by Step Solution
There are 3 Steps involved in it

Get step-by-step solutions from verified subject matter experts