

Question: Can someone explain why this is getting an error and correct it for me? Thanks! Create a function plot( x, y, Xerrors, Yerrors, Xlabel, Ylabel)
Can someone explain why this is getting an error and correct it for me? Thanks!
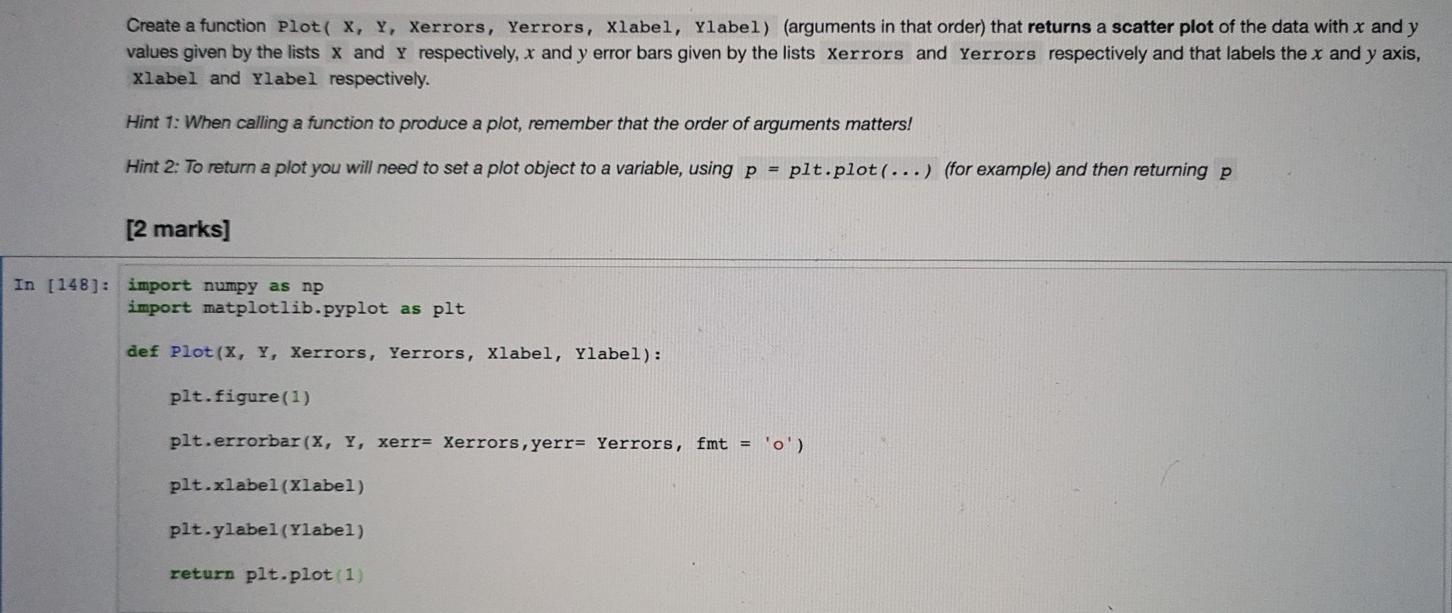
Create a function plot( x, y, Xerrors, Yerrors, Xlabel, Ylabel) (arguments in that order) that returns a scatter plot of the data with x and y values given by the lists x and y respectively, x and y error bars given by the lists Xerrors and Yerrors respectively and that labels the x and y axis, xlabel and Ylabel respectively. Hint 1: When calling a function to produce a plot, remember that the order of arguments matters! Hint 2: To return a plot you will need to set a plot object to a variable, using p = plt.plot(...) (for example) and then returning p [2 marks] In [148]: import numpy as np import matplotlib.pyplot as plt def Plot(X, Y, Xerrors, Yerrors, xlabel, Ylabel): plt. figure(1) plt.errorbar(x, y, xerr= Xerrors, yerr= Yerrors, fmt = '0') plt.xlabel(xlabel) plt.ylabel(Ylabel) return plt.plot 1)
Step by Step Solution
There are 3 Steps involved in it

Get step-by-step solutions from verified subject matter experts